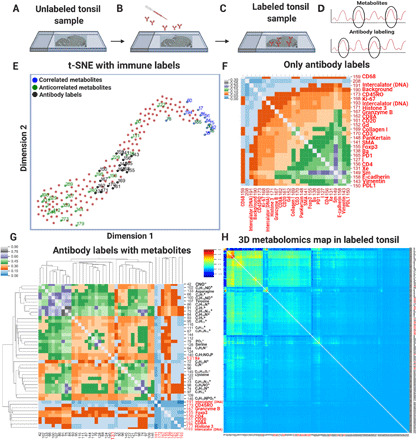
Fig. 3. Isotope-conjugated antibodies were labeled on tissue sections.

(A) Cell-specific labeling of an unlabeled tonsil-sliced sample using an isotope-tagged antibody library. (B) Specific cellular features and metabolic compounds were identified. (C) After labeling, the tonsil tissue was analyzed by TOF-SIMS imaging to acquire a 3D dataset. (D) The t-SNE plot exhibited the highest correlated metabolites (blue), anticorrelated metabolites (green), and isotope-tagged antibody labels (black) in the labeled tissue dataset. (E) The calibrated mass spectra consisted of 189 compounds that contained 20 peaks for cell features and 169 peaks for metabolites. (F) Pairwise 3D correlations for only the antibody-labeled masses of the isotope antibody–labeled tonsil dataset across 20 binned slices were shown on a hierarchically clustered heatmap. (G) A clustered heatmap was used to represent the pairwise 3D correlations between a subset of metabolic compounds and cell-specific labels. (H) The hierarchically clustered heatmap showed pairwise 3D correlations of the five binned slices of the metabolite compounds and antibody labels. The dominant red/green colors in the heatmaps included a colormap for blue (low correlations), green (medium correlations), and red (high correlations).
