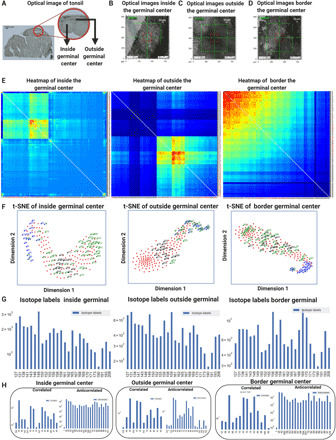
Fig. 4. Cell type–specific and metabolic correlations for the GC in tonsil tissues.

(A) An optical imaging technique was used to observe the 5-μm sliced tonsil section before TOF-SIMS. (B) The selected ROI was identified consistently between the optical imaging platform and the TOF-SIMS platform. In the TOF-SIMS device, an internal optical camera was used to align the ROIs. (C) The image showed the outside of the GC captured by the internal optical camera before the TOF-SIMS measurement process. (D) The images were shown for the border of the GC captured by the internal optical camera image before the TOF-SIMS measurement process started. (E) Comparative hierarchically clustered heatmaps for the 3D correlations were implemented for inside, outside, and at the border of the GC in the labeled tonsil datasets, yielding unique lipidomic features in each dataset. (F) Comparative t-SNE maps of the same GC of the labeled tonsil tissues was displayed. The t-SNE contained correlated (blue), anticorrelated (green), and antibody-labeled (black) channels. (G) Bar plots of the secondary ion signal levels were computed for the selected antibody labels and the metabolite compounds. (H) The bar graphs showed the 50 highest correlated and anticorrelated rankings of metabolic pairs from the 3D Pearson correlations.
