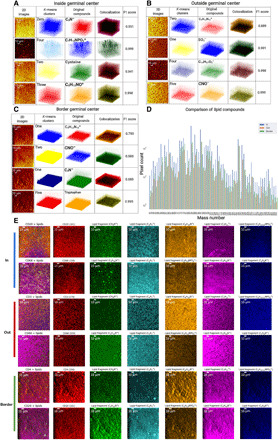
Fig. 5. 3D clustering of metabolic fragments in spatially distinct cell distributions in tissues.

(A) The prominent mass channels were identified in the inside GC dataset that contained 50 and 385 m/z (C23H45O4, cholesterol) and 122 and 98 m/z (C5H12NO+, lipid). The first column contains pixel-binned images, the second column shows the 3D clusters, and the third column displays the 3D visualization of voxels of the four metabolic channels. The 3D overlaps between metabolites and clusters were represented using colocalization in the fourth column and an F1 score in the range of 0.661 to 0.982 in the fifth column. (B) The prominent mass channels in the outside GC are 75, 80, 229, and 42 m/z. The F1 scores were 0.889 to 0.999. (C) The prominent mass channels in the border GC are 75, 42, 50, and 144 m/z. The F1 scores were 0.683 to 0.995. (D) A comparison of the detected metabolic compounds was shown in the form of a bar graph. Distinct distributions of lipidomics were obtained for inside, outside, and at the border of the same GC. (E) A comparison of TOF-SIMS mass channel images that were overlaid using the identified immune labels and lipid fragments. In each row, immune markers and lipid fragment metabolic images were assigned to unique colors.
