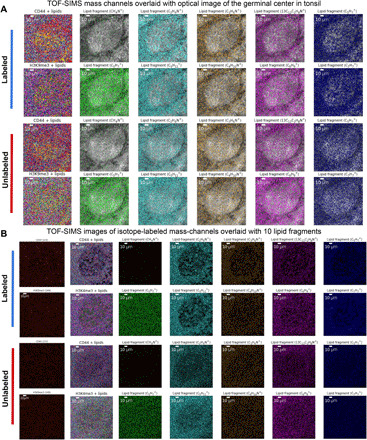
Fig. 6. Spatially resolved clustering and coloring of isotope-labeled and unlabeled GC in serial tonsil sections.

(A) A comparison of TOF-SIMS mass channel images overlaid on microscopy images with lipid fragments from the labeled and unlabeled GC was shown. Two rows of lipid fragment metabolic images were assigned a unique color and then overlaid together with the morphological image. (B) A comparison of TOF-SIMS mass channel images overlaid from the isotope-labeled mass data of immune targeted channels and lipid fragments for labeled and unlabeled GC was shown. Each row immune marker and lipid fragment metabolic image were assigned a unique color and then overlaid together.
