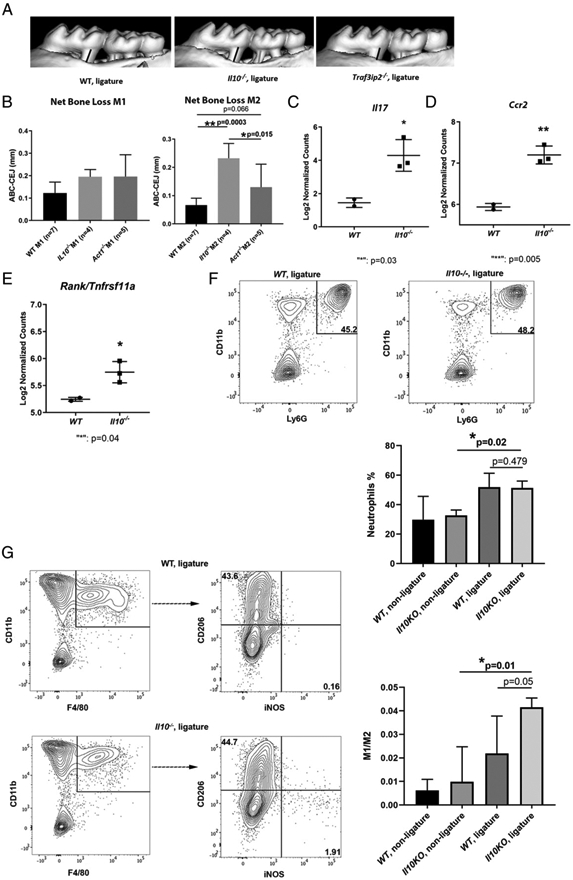
FIGURE 6.

Alveolar bone loss and IL-17–mediated inflammatory response in gingival tissues in a ligature-enabled plaque accumulation-induced murine periodontitis model. A ligature was placed between the m1 and m2 on the right side and kept for 11 d. mCT measurements were performed between the CEJ to ABC from the distal root of the m1 and the mesial root of the m2 on the right side of maxilla after ligature placement. Representative μCT scans are shown (A). The black bar indicates the distance between CEJ of the distal root of m1 to ABC, whereas the gray bar indicates the distance between CEJ of the mesial root of m2 to ABC. The bone level of the distal root of m1 and mesial root of m2 was compared among WT, Il10 KO, and Act1 KO mice (B). Transcriptional expressions of Il17 (C), chemokine receptor Ccr2 (D), and bone resorption signal Rank/Tnfrsf11a (E) were compared between WT and Il10 KO mouse gingiva from the ligatured site by NanoString gene expression analysis. Direct mRNA counts were normalized first by nSolver software and then log2 transformed for comparison. Representative flow cytometry plots show the percentage of neutrophils (CD11b+F4/80−Ly-6G+) that were previously gated on CD45+cells from the ligature side of WT gingiva (F, left panel) and the ligature side of Il10−/− mouse gingiva (F, right panel). The comparisons of neutrophil infiltration in murine gingiva are also shown (F, lower panel). Representative flow cytometry plots show the percentage of M1-skewed (CD45+CD11b+Ly-6G−F4/80+iNOS+CD206−) and M2-skewed (CD45+CD11b+Ly-6G−F4/80+iNOS−CD206+) macrophages from the ligature side of WT mouse gingiva (G, upper panel) and the ligature side of Il10−/− mouse gingiva (G, lower panel). The ratios of M1/M2 were compared among different groups of gingival tissues (G, right panel). ANOVA test was applied for bone level comparisons and flow cytometry data, whereas Student t test was applied for mediator expression. Bone loss was shown as the means ± SD. Samples were pooled from two independent experiments of the ligature-induced periodontitis model for bone level analysis. Each dot or square indicates one sample for mediator transcriptional expression analysis. For flow cytometry analysis, gingival tissues from the ligature side or the nonligature side were pooled from three animals with the same genotype for each experiment. Three independent experiments were included for statistical analysis. Gingival tissues from the contralateral side of the maxilla where no ligature was placed were used as controls. *p < 0.05, **p < 0.01.
