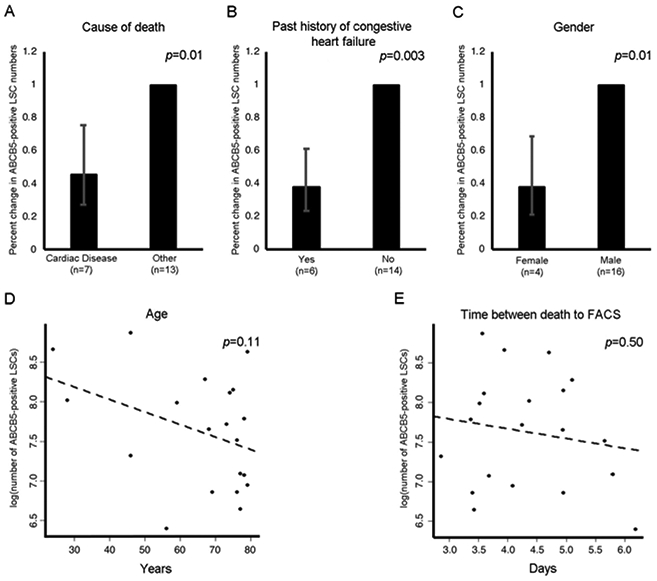
Figure 2. Factors associated with ABCB5-positive LSC isolation yield.

Bar graphs represent linear regression analysis of the factors negatively associated with the yield of ABCB5-positive LSCs: cause of death (A), past history of congestive heart failure (B) and gender (C). Scatter plots represent linear regression analysis of the factors that show a trend to be negatively associated with the yield of ABCB5-positive LSCs: donor age (D) and time between death to FACS (E). Error bars represent 95% confidence interval.
