Fig. 2.

Early phase of graft implantation
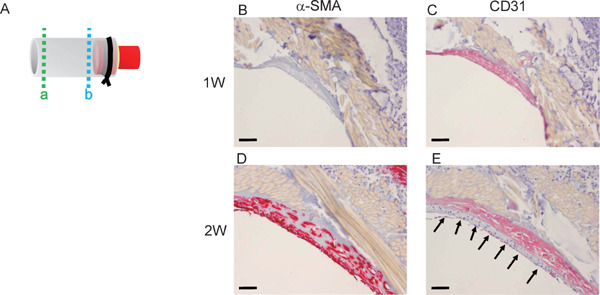
A, Scheme of harvested graft. The graft was cut transversely in the middle into two pieces and then embedded in paraffin. The portion of dotted line “a” is near the midline. The portion of dotted line “b” is near the cuff. B and C, Section of the graft 1 week after implantation, near dotted line “b”. There were no α-SMA + (B) or CD31 + (C) cells (scale bar, 50µm). D and E, At 2 weeks after implantation, α-SMA+ cells (D) and CD31+ cells (E) appeared in the neointima. Arrows in E indicate CD31+ cells (scale bar, 50 µm).
