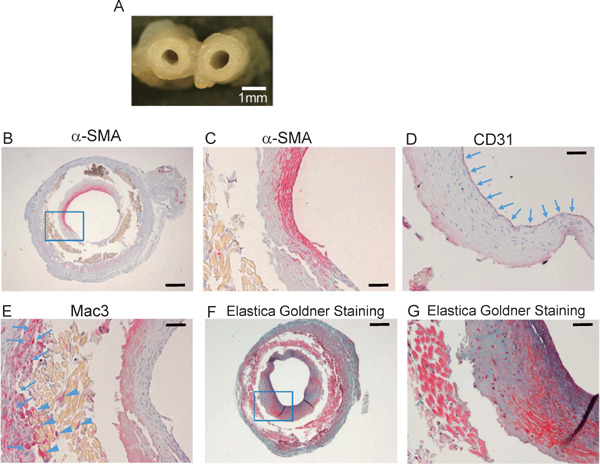
Fig. 3.

Histological analysis of grafts at 4 weeks after implantation
A, Cross-sectional image of harvested graft at 4 weeks (scale bar, 1 mm). B, Cross-section of graft at 4 weeks after implantation around dotted line “a” (Fig. 2A), stained with anti-α-SMA antibody (scale bar, 250 µm). C, High-power field view of blue square in B (scale bar, 50 µm). D and E, The luminal surface was covered by CD31+ cells (arrows in D). Mac3+ cells accumulated outside (arrows in E) and in the graft fibers (arrow heads in E) (scale bar, 50 µm). F, Elastica–Goldner staining of the section (scale bar, 250 µm). G, High-power field view of blue square in F. Green area indicates collagen fibers, and purple area indicates elastin fibers (scale bar, 50 µm).
