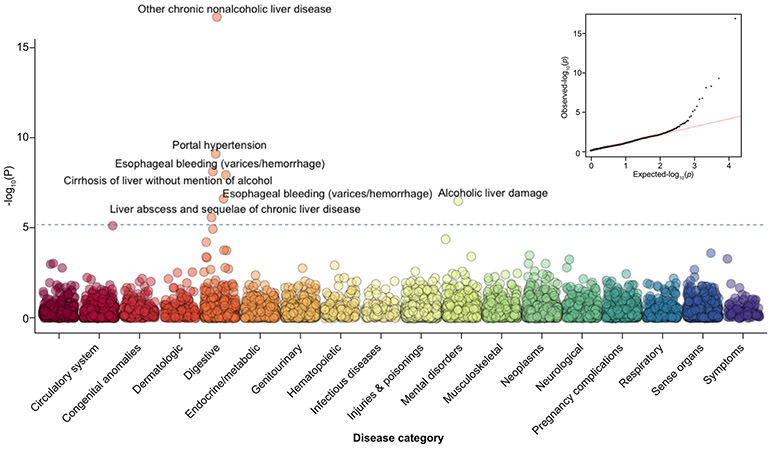
Fig. 3. PheWAS Manhattan plot of PNPLA3 Ile138Met vs. ICD9 diagnosis codes.
The x-axis represents categories of disease as defined by ICD9 coding hierarchy. The y-axis is the −log10 p value for the association. Adjustment for age, sex, PCs 1-6. Bonferroni significance for multiple testing was p <6.37 × 10⁻⁶. PheWAS, phenome-wide association study.

