Figure 3.
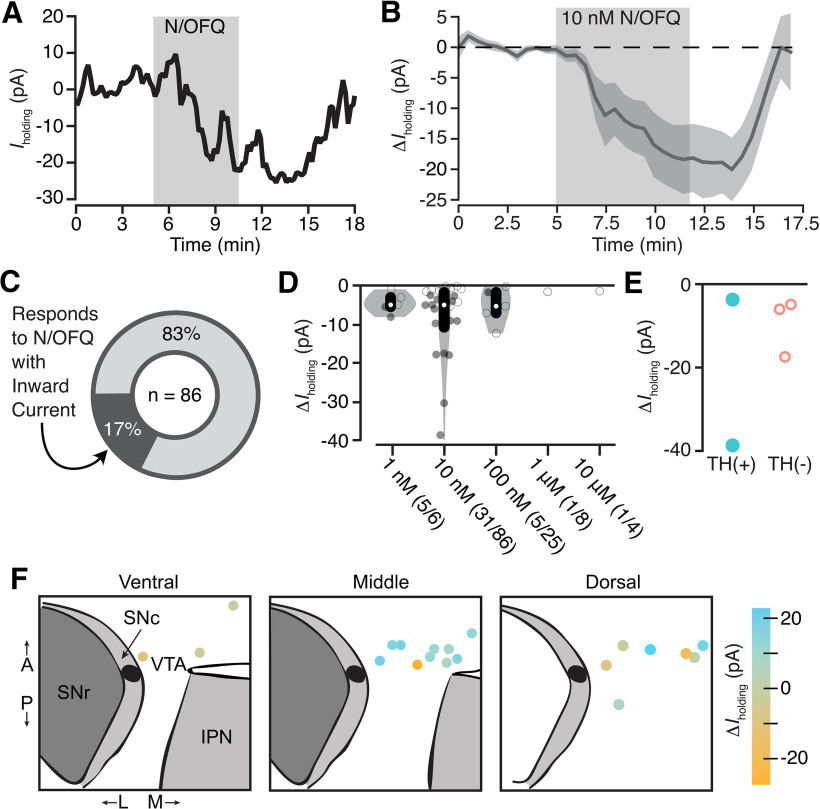
Low-dose N/OFQ-induced small inward currents in a subset of VTA neurons. A, Example voltage-clamp recording (Vclamp = −60 mV) of a VTA neuron that responded to N/OFQ with an inward current. B, The mean ± SEM time course across neurons with inward currents shows the onset of this response is time locked to the initiation of drug application (n = 15). C, Across all VTA neurons from control rats that were tested for 10 nm N/OFQ responses, 17% responded with a significant inward current. D, Concentration response data for each neuron showing a negative change, both significant (filled circle) and not significant (open circle), in holding current with N/OFQ application (gray markers include all neurons with a change <0 pA; median shown in white dots; black bars show 25th and 75th percentiles). Significant inward currents were observed at 10 nm, while higher concentrations only generated outward currents (Fig. 1E). E, Inward currents were observed in both immunocytochemically identified TH(+) and TH(–) neurons. F, Locations of VTA recordings show that neurons that responded to N/OFQ with inward and outward currents were intermixed.

