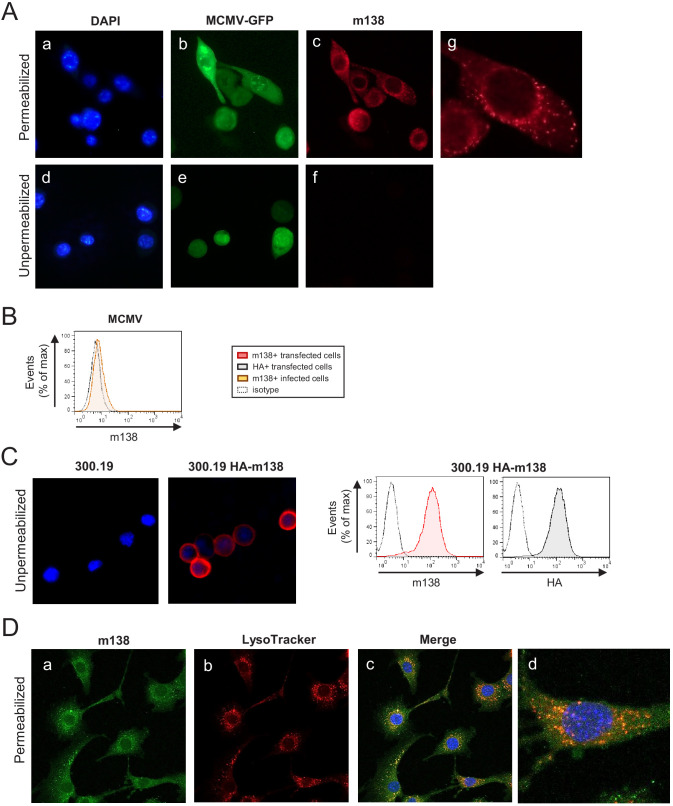
Figure 3. Localization of m138 in MCMV-infected cells.
(A) NIH3T3 cells were infected with MCMV-GFP at an moi of 5 for 24 hr, fixed with 4% formaldehyde (panels d-f) or fixed and permeabilized with 0.05% Triton (panels a-c and g), and stained with the anti-m138 mAb followed by an anti-mouse IgG-A555. Nuclei were stained with the DAPI reagent. The cells were examined under a fluorescence microscope. Magnification, ×20 (a-f); an enlarged individual cell from panel c is shown in panel g. (B) MCMVwt-infected NIH3T3 cells were examined by flow cytometry for surface expression of m138 with the anti-m138 mAb (red histogram). Dotted line represents the isotype control. (C) 300.19 cells untransfected or stably transfected with the HA-m138 construct were fixed with 4% formaldehyde and stained with the anti-m138 mAb and DAPI and examined under a fluorescence microscope as indicated in A. Magnification, ×20. Overlaid images are shown. Transfected cells from the same cultures were analyzed by flow cytometry (right panels) with the anti-m138 mAb (red histogram), an anti-HA mAb (gray histogram) or isotype controls (dotted lines). (D) NIH3T3 cells were infected with MCMV at an moi of 5 for 24 hr, treated with LysoTracker DND99, fixed with 4% formaldehyde and permeabilized with 0.02% Saponin, and stained with the anti-m138 mAb followed by an anti-mouse IgG-A488. Nuclei were stained with the DAPI reagent. The cells were examined under a confocal microscope. Representative fields are shown in panels a, b, and c, with an enlargement of an individual and more exposed cell from panel c, in panel d. Magnification, ×63.


