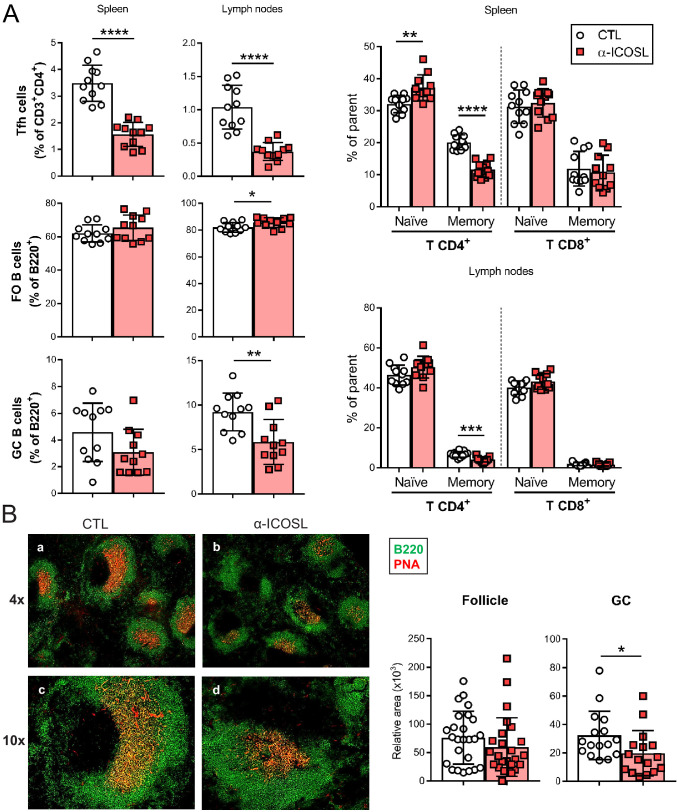
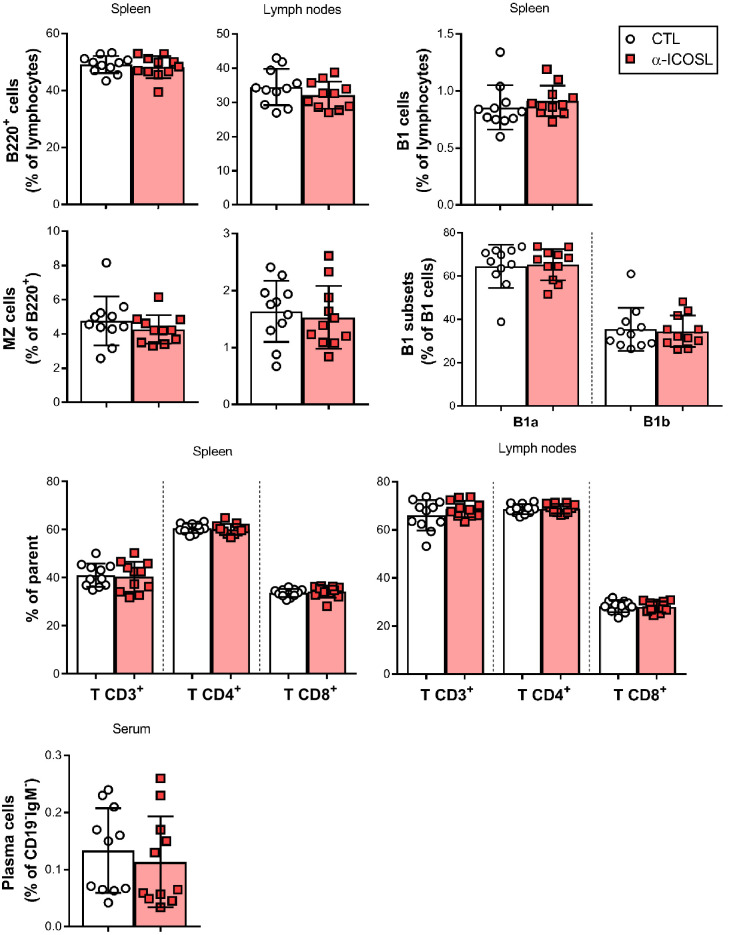
Figure 9. Blockade of ICOSL reduces the frequency of particular lymphocyte subsets in the spleen and lymph nodes of MCMV-infected mice.
(A) BALB/c mice (n = 11–12/group) were i.p. inoculated with 2 × 10⁶ PFU of MCMVΔm138 and treated with (α-ICOSL) or without (CTL) 100 mg of anti-ICOSL mAb. At day 14 post-infection mice were sacrificed, and spleens and lymph nodes were isolated and disaggregated. Cell suspensions were analyzed by flow cytometry using anti-mouse CD3, CD4, CD8, CD44, CD62L, CXCR5, and PD1 for T-cell phenotype. For B cell phenotype B220, CD21, CD23, CD95, and GL7 mAbs were used. Percentages of Tfh cells (CD3+CD4+CXCR5hiPD1hi), germinal center (GC) B cells (CD95hiGL7hiB220+), follicular (FO) B cells (CD21+CD23+B220+), and CD3+CD4+ or CD3+CD8+ naive (CD44lowCD62Lhi) and memory (CD44hiCD62Llow) T cells from these two organs are shown. (B) Representative immunofluorescence of spleens from mice infected and treated with (panels b and d) or without (panels a and c) the anti-ICOSL mAb, as indicated in A. Two color colocalization with B220 in green and peanut agglutinin (PNA) in red are shown at ×4 and ×10 magnifications. Panels on the right show a graphic representation of follicle and GC relative areas from tissue sections of a representative mouse of each experimental group. In graphs shown in A and B, results are expressed as mean +/-SD. Mice treated with anti-ICOSL mAb are represented as red squares and mice not receiving the mAb are represented as open circles. Two-tailed unpaired t-tests were used to assess statistical differences between experimental groups. *p<0.05, **p<0.01, ***p<0.001, ****p<0.0001. Data are pooled from two independent experiments.


