FIGURE 2.

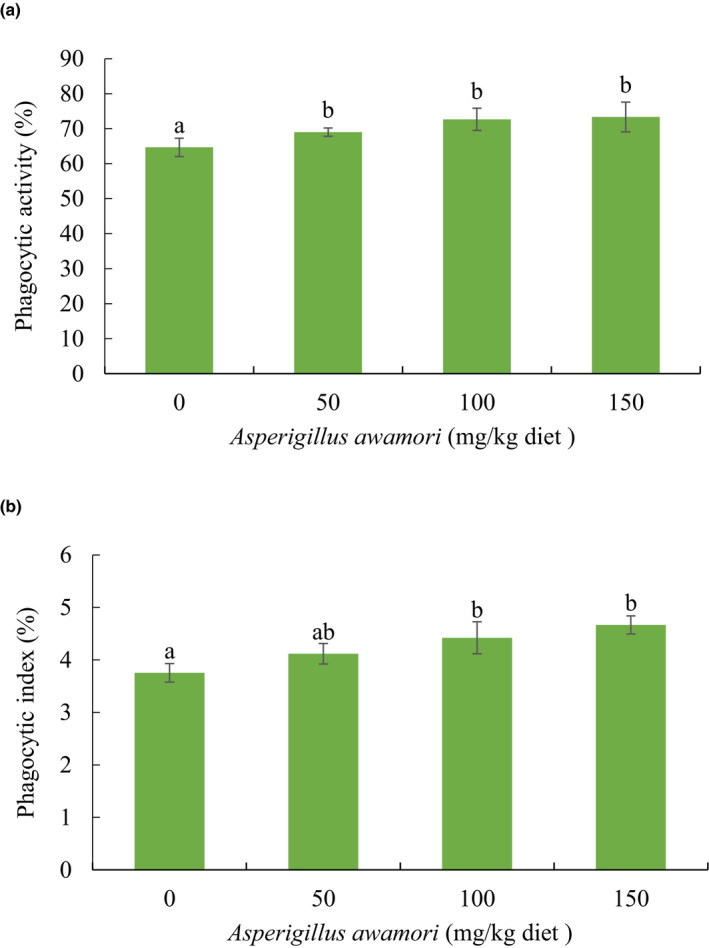
(a) Phagocytic activity and (b) phagocytic index of rabbits fed varying levels of Aspergillus awamori. Values expressed as means ± SEM. Different superscript letters indicate significant differences (p < .05)

(a) Phagocytic activity and (b) phagocytic index of rabbits fed varying levels of Aspergillus awamori. Values expressed as means ± SEM. Different superscript letters indicate significant differences (p < .05)