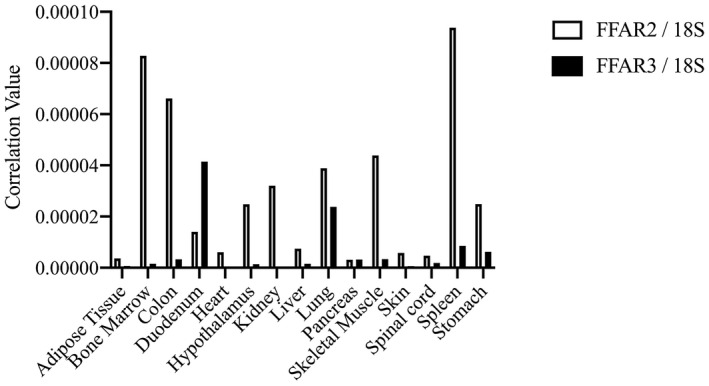
FIGURE 2.

Tissue distribution of FFAR2 and FFAR3 mRNA in the adult cats. FFAR2 and FFAR3 mRNA expression patterns in adult cat tissues were determined by qPCR analysis. Expression levels of FFAR2 and FFAR3 are represented as values corrected to 18S ribosomal RNA. White bars represent FFAR2; black bars represent FFAR3
