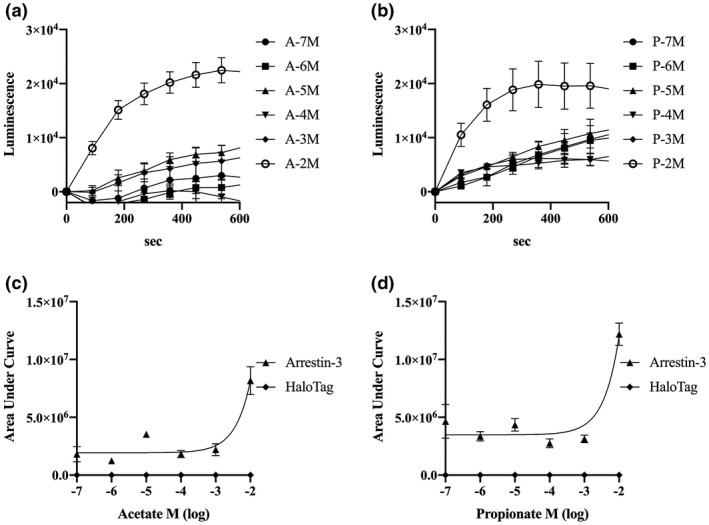
FIGURE 5.

Transient interaction of Arrestin‐3 and cat FFAR2 or FFAR3 expressed in live cells. The interaction of Arrestin‐3 and FFAR2 or FFAR3 after treatment for 0 s with acetate (a: FFAR2, 1 × 10⁻² ~ −7 M) or propionate (b: FFAR3, 1 × 10⁻² ~ −7 M). Luminescence was detected as signals and recorded for 10 min, represented as the area under the curve for FFAR2 (c) and FFAR3 (d). Values are expressed as mean ± SEM (n = 4)
