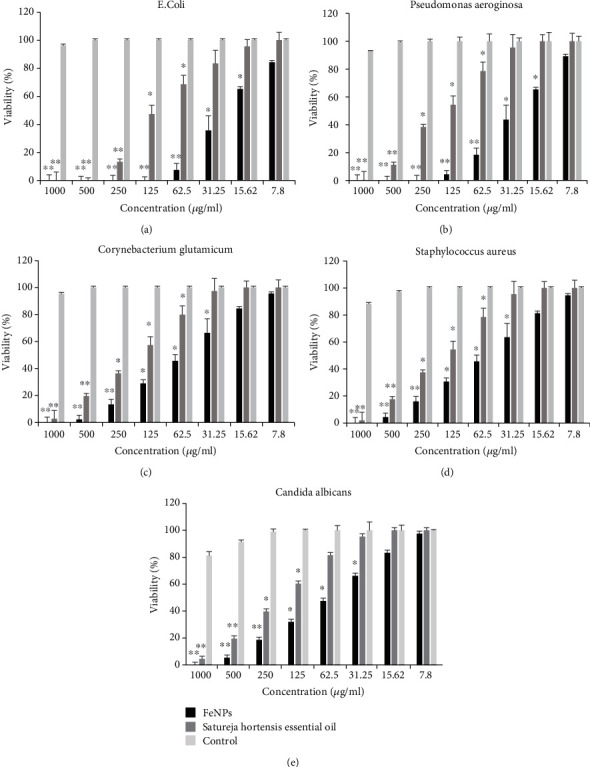
Figure 9.

Comparative MIC data (μg/ml) from different concentrations of FeNPs and SH essential oil against five pathogenic microbe strains. (a) Escherichia coli, (b) Pseudomonas aeruginosa, (c) Corynebacterium glutamicum, (d) Staphylococcus aureus, and (e) Candida albicans. Each bar represents the mean ± SD (standard deviation) of three independent tests; ∗ and ∗∗ represent statistical significance between control versus each microbe at ∗P < 0.01 considered significant and ∗∗P < 0.001 highly significant levels using (ANOVA)/Tukey tests.
