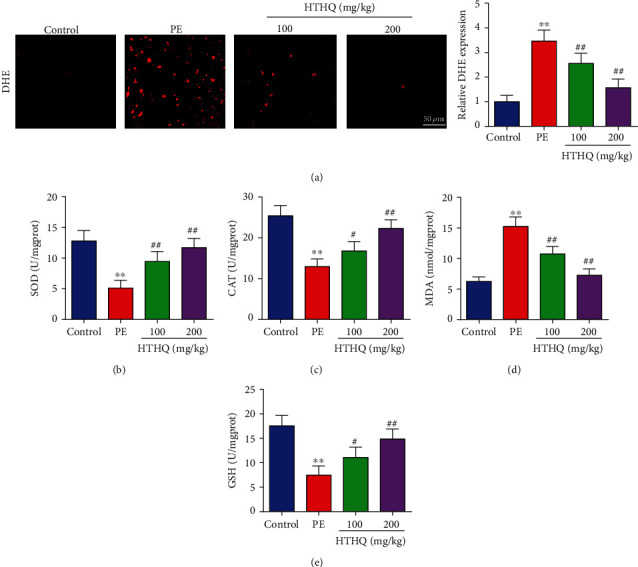
Figure 3.

HTHQ treatment attenuated oxidative stress induced by PE. DHE staining was used to assess the ROS production in each group (n = 6). The levels of SOD (b), CAT (c), MDA (d), and GSH (e) in each group (n = 6). ∗∗P < 0.01 vs. the control group; #P < 0.05 and ##P < 0.01 vs. the PE group.
