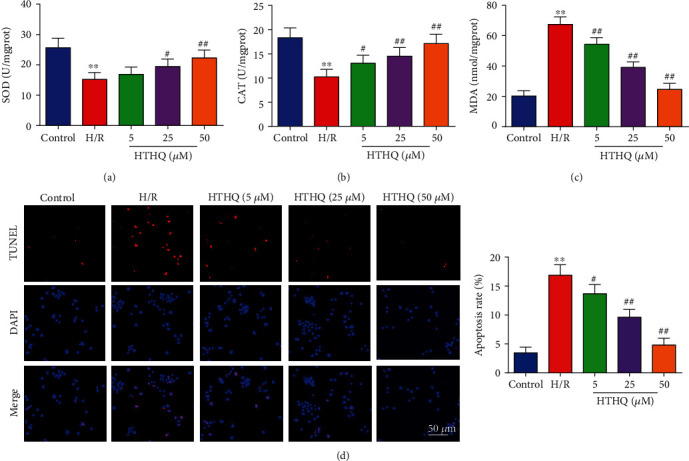
Figure 5.

HTHQ treatment attenuated oxidative stress and apoptosis in HUVECs following H/R. The levels of SOD (a), catalase CAT (b), and MDA (c) in each group (n = 6). (d) Images and quantifications of TUNEL staining in each group (n = 6). ∗∗P < 0.01 vs. the control group; #P < 0.05 and ##P < 0.01 vs. the H/R group.
