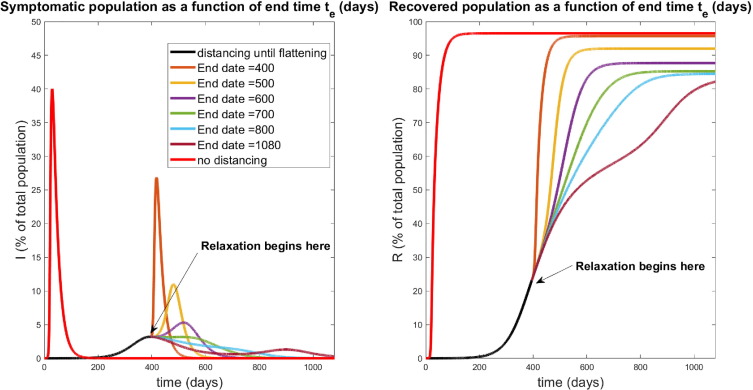
Fig. 20.
Relaxation that was started during flattening. Symptomatic (left) and recovered (right) populations for policies which relax social distancing at a rate determined (inversely) by , the day at which distancing policies are completely removed. The response for no social distancing implemented is included for reference (red curves). All curves besides the red curve are identical for the first days of treatment, when social distancing is implemented with per day for . Note that a second wave occurs for relaxation protocols that end too quickly ( days). However, if relaxation is slow enough (larger ), a second wave of infection is mitigated. All simulations are taken over 1080 days.

