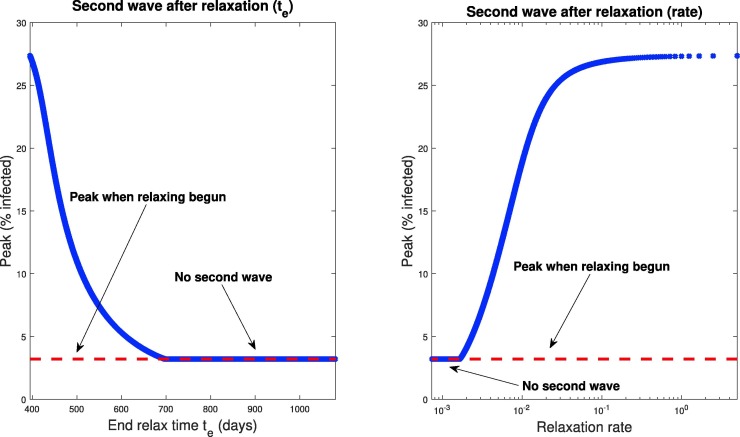
Fig. 21.
Magnitudes of peak of symptomatic individuals (percentage of total population) as a function of end time (left) and rate (right). Note that and relaxation rate are inversely proportional; see Eq. (64). Relaxation is begun when the symptomatic population first “flattens,” which is indicated by the dashed red line in the figure, and occurs for all schedules at day . A peak equal to the dashed red line thus indicates that no second wave of infections occurs, i.e. there was never a day when the number of infected individuals was greater than the peak when relaxation was commenced. All simulations are taken over 1080 days.

