FIG. 2.
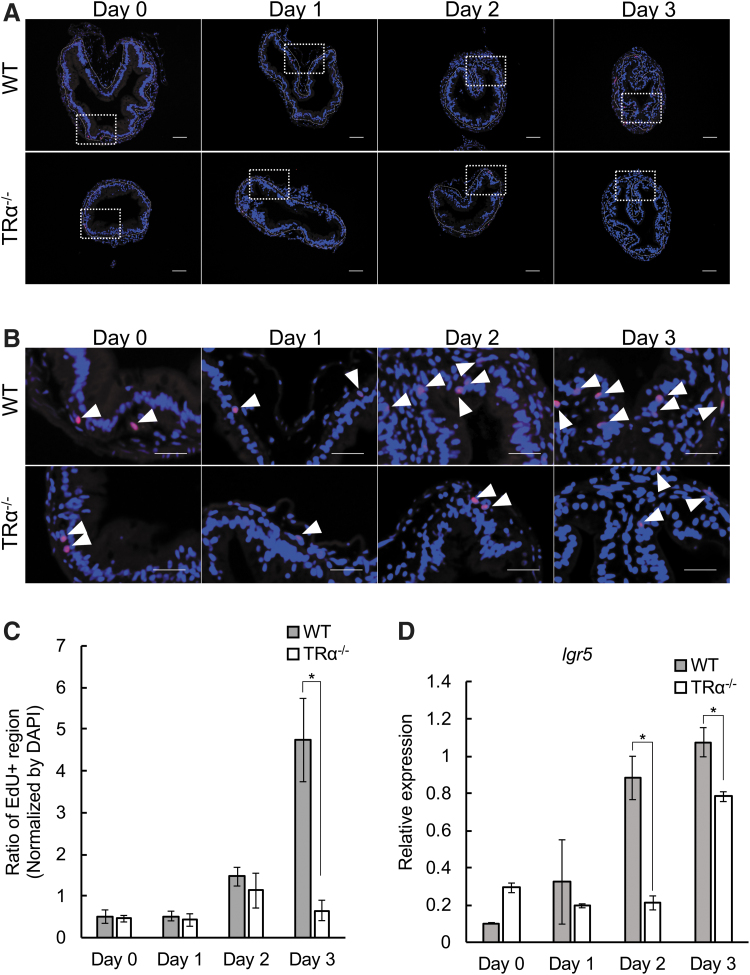
TRα knockout inhibits T3-induced epithelial cell proliferation during metamorphosis. (A) Proliferating cells in the TRα−/− intestine after three days of T3 treatment are reduced compared with those in the wild-type intestine. The intestinal sections from stage 54 tadpoles treated with 10 nM T3 for up to three days were double-stained with EdU for cell proliferation (red) and DAPI for DNA (blue). The dotted white lines depict the epithelium–mesenchyme boundary. Scale bar indicates 20 μm. (B) The boxed regions in (A) are shown at a higher magnification. White arrowheads denote EdU-positive cells. Scale bar indicates 10 μm. (C) Quantification of cell proliferation as detected in (A, B). The EdU-positive areas (red) in the epithelium were quantified with the ImageJ software and normalized against the total cellular area in the epithelium as determined by DAPI staining. The asterisk (*) indicates a significant difference between the TRα−/− tadpoles and wild-type tadpoles (p < 0.05). Experiment was repeated twice, and each bar represents the mean + S.E. (D) The expression of the adult intestinal stem cell marker lgr5 is reduced in the TRα−/− intestine. Total intestinal RNA from wild-type and knockout stage 54 tadpoles treated with 10 nM T3 for up to 0–3 days was analyzed by RT-PCR for the expression of lgr5. Note that lgr5 was upregulated by T3 after two to three days of T3 treatment in wild-type animals, and this upregulation was delayed/reduced in the knockout tadpoles. DAPI, 4′,6-diamidino-2-phenylindole; EdU, 5-ethynyl-2′-deoxyuridine; RT-PCR, reverse transcription polymerase chain reaction.

