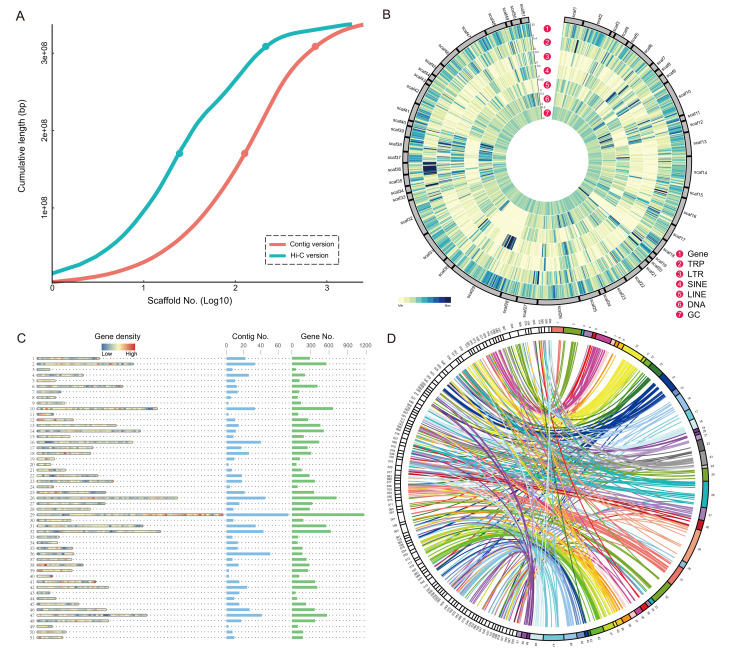
Figure 1.
Statistics and evaluation of Hi-C-based genome assembly
A: Cumulative assembly length of sequences from two genome assemblies of C. quinquecirrha. Two versions, including previously published contig version (Xia et al., 2020) and Hi-C version from this study, were used in statistical analysis. Dots above and below each line indicate L50 and L90 values, respectively. B: Scaffold-level genome assembly of C. quinquecirrha. Assembly results are shown in Circos diagram, with outer to inner rings showing distribution of protein-coding genes, tandem repeats (TRP), long tandem repeats (LTR), short interspersed repetitive elements (SINE), long interspersed repetitive elements (LINE), DNA elements, and GC content, respectively. C: Distribution of contigs and coding genes in each scaffold. Plot shows gene density distribution, contig number, and coding gene number in each scaffold, from left to right. D: Synteny of genomes between scaffold-level C. quinquecirrha and A. aurita. Syntenic blocks are linked between two genomes with a Circos plot.

