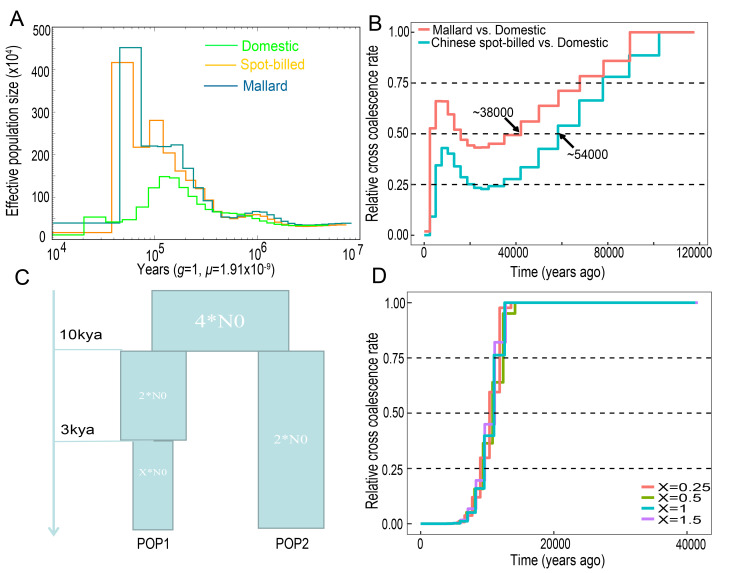
Figure 3.
Demographic history of ducks
A: Demographic history inferred by PSMC with a generation time=1 year and mutation rate=1.91×10⁻⁹. B: Inferred relative cross-coalescence rates between pairs of populations over time based on two individuals of spot-billed, mallard, and domestic ducks. C: Demographic scenarios simulated by ms software (X=0.25, 0.5, 1, and 1.5, representing current population sizes equal to 12.5%, 25%, 50%, and 75% of ancestral population size, respectively). D: MSMC analysis of simulated data.

