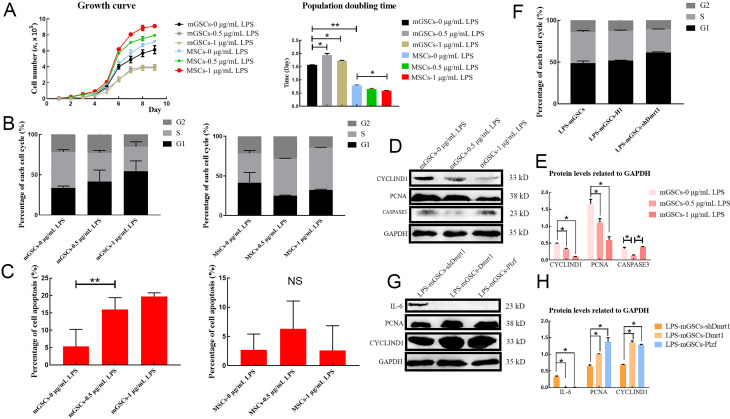
Figure 6.
Dmrt1 repressed apoptosis and promoted proliferation of mGSCs
A: Growth curve and population doubling time (PDT) of mGSCs and MSCs under treatment with different concentrations of LPS. B: Flow cytometry of cell cycle in mGSCs and MSCs under LPS treatment (0, 0.5, and 1 μg/mL). C: Flow cytometry of cell apoptosis in mGSCs and MSCs under LPS treatment (0, 0.5, and 1 μg/mL). D: Western blotting of cyclin-D1, PCNA, and caspase-3 in mGSCs under treatment with different concentrations of LPS. E: Protein levels were quantified using ImageJ software and normalized to GAPDH. F: Flow cytometry of cell cycle in LPS-mGSCs, LPS-mGSCs-H1, and LPS-mGSCs-shDmrt1. G: Western blotting of IL-6, PCNA, and cyclin-D1 in LPS-mGSCs-Dmrt1 and LPS-mGSCs-Plzf. H: Protein levels were quantified using ImageJ software and normalized to GAPDH. *: P<0.05;**: P<0.01;***: P<0.001.

