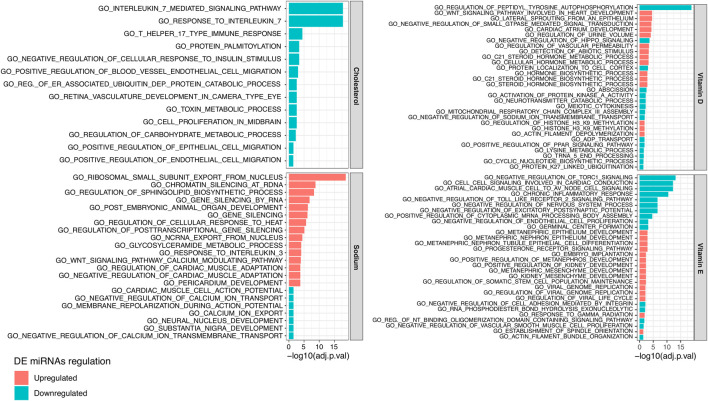
FIGURE 3.
Bar plot reporting the 15 top significant Gene Ontology (GO) Biological Processes enriched in the target genes of plasmatic miRNAs resulting downregulated (in blue) or upregulated (in red) between subjects characterized by a higher or lower estimated intake of (from the top left corner in clockwise order) cholesterol, vitamin D, sodium, or vitamin E.

