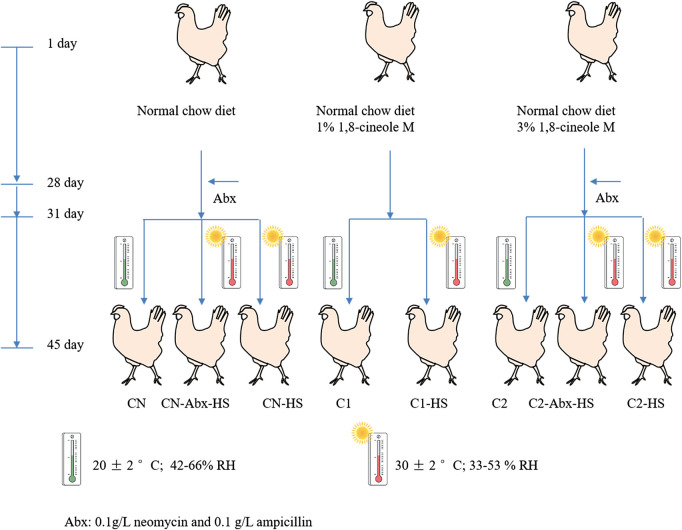
FIGURE 1.
Flow chart of chicken processing. Notes: The chickens were separated into eight groups with twenty chickens per group for observation of performance parameters. Six of the chickens from each testing group were subjected to molecular biological index testing. CN: normal chow-diet for forty-five days; CN-HS: normal chow-diet for forty-five days and heat stress treatment on Day 31 of experiment for fifteen days; C1: 1% 1,8-cineole microcapsules for forty-five days; C1-HS: 1% cineole microcapsules for forty-five days and heat stress treatment on Day 31 of experiment for fifteen days; C2: 3% 1,8-cineole microcapsules for forty-five days; C2-HS: 3% 1,8-cineole microcapsules for forty-five days and heat stress treatment on Day 31 of experiment for fifteen days; CN-Abx-HS: normal chow-diet for forty-five days and Abx for three days on Day 28 and HS treatment on Day 31 for fifteen days. C2-Abx-HS: 3% 1,8-cineole microcapsules for forty-five days and Abx for three days on Day 28 and HS treatment on Day 31 for fifteen days.

