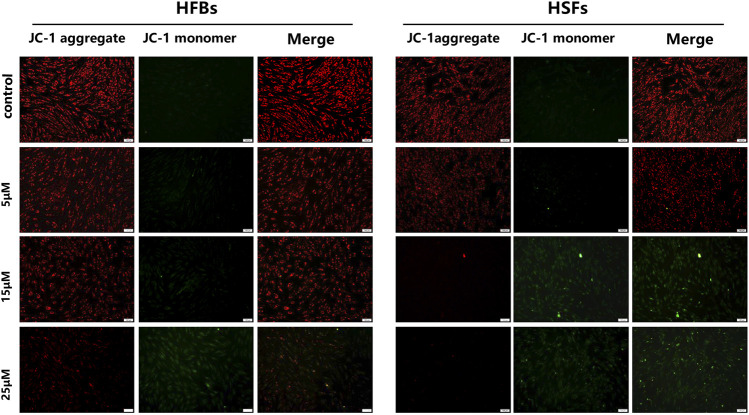
FIGURE 4.
Mitochondrial membrane potential was measured by JC-1 assay kit. Red fluorescence represented JC-1 aggregate in mitochondria and green fluorescence indicated JC-1 monomer in mitochondria. The results showed that the mitochondrial membrane potential changed more obviously with the increase of ABT-263 concentration in HSFs when compared with HFBs. Scale bars: 100 μm.

