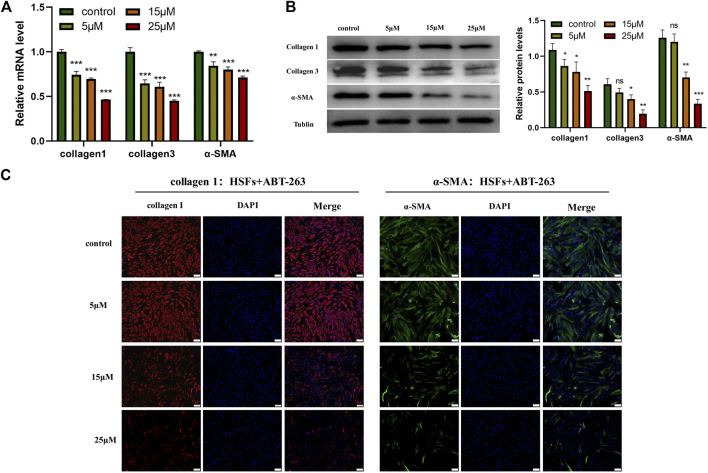
FIGURE 7.
ABT-263 reduced the expression of α -SMA, collagen I, and collagen III in HSFs. (A) The mRNA expression levels of α -SMA, collagen I, and collagen III in HSFs after treatment with different concentration of ABT-263 were determined by PCR. n = 3. (B) The protein expression levels of α-SMA, collagen I, and collagen III in ABT 263-treated HSFs were determined by western blot. n = 3. (C) The protein expression levels of collagen I and α-SMA in ABT-263 treated HSFs were further confirmed by immunofluorescence staining. Collagen I was stained with red, α-SMA with green, and nuclei with blue. Scale bars: 100 μm. Data represented the means ± SD. *p < 0.05, **p < 0.01, ***p < 0.001, and n.s., no significance. vs. control.

