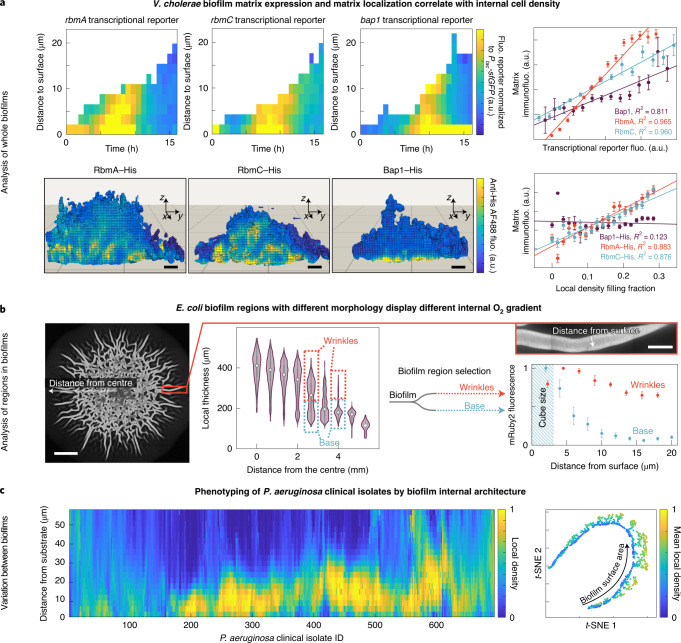
Fig. 2. Applications of spatial image cytometry for characterizing biofilm biology.
a, By analysing biofilm spatiotemporal development of whole V. cholerae microcolonies in flow chambers, the transcription of key matrix biosynthesis genes was correlated with matrix localization and the cell density structure inside biofilms. Top left, the space–time kymographs of reporters for rbmA, rbmC and bap1 transcription were normalized to the signal of constitutively expressed sfGFP. Representative of n = 3 independent biofilms for each reporter. Top right, for biofilms grown to a particular timepoint (15 h), the correlation of the spatial distribution of transcriptional reporters and matrix localization immunofluorescence signal was analysed. Data are mean ± s.e.m. across 100–300 cubes for one biofilm. Representative of n = 3 independent biofilms for each reporter. Bottom left, renderings of the immunofluorescence localization for biofilms grown up to 15 h show a characteristic biofilm internal spatial distribution for each matrix component. Scale bars, 2 µm. Bottom right, RbmA and RbmC show a high correlation (R2) with the biofilm internal cell density, measured as the local density filling fraction per cube. Data are mean ± s.e.m. across 100–300 cubes for one biofilm, representative of n = 3 independent biofilms for each reporter. Fluo., fluorescence. b, For E. coli macrocolonies on agar, cube cytometry was used to measure the distribution of the local biofilm thickness, revealing quantitative signatures of the wrinkles and the flat biofilm base. By analysing the wrinkles and the base as different subpopulations (shown for one colony, representative for n = 3 colonies), the spatial distribution of fluorescence patterns was measured in the wrinkles and base. Data are mean ± s.e.m. between n = 5 different wrinkles and n = 6 different 400 µm2 regions of the biofilm base. Here, the mRuby2 fluorescence was used as a proxy for O2 penetration, as mRuby2 requires O2 to fold into a fluorescent conformation. Scale bars, 2 mm (left) and 100 µm (inset). c, For 694 P. aeruginosa wild-type clinical isolates, the 3D internal biofilm architecture was analysed (n = 2 biofilm images for each strain), resulting in 420 parameters for each strain. The spatial distribution of one structural parameter (the local density) is shown here for each strain in the heat map. Dimensionality reduction using t-distributed stochastic neighbour embedding (t-SNE) revealed that the strains primarily differ in two biofilm structural parameters (mean local density and biofilm surface area).

