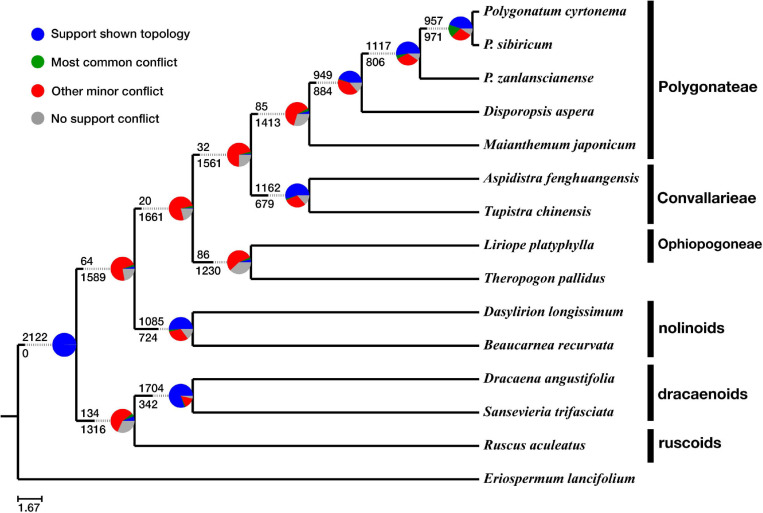
FIGURE 3.
ASTRAL-III tree shows gene–tree conflict with pie chart at each node as the following: proportion of gene trees in concordance (blue), in conflict with the dominant alternative topology (green), in conflict with all other topologies (red), and unsupported with less than 50% bootstrap scores (gray).

