

Abstract
Background
Studies looking at associations between environmental chemicals and child behaviour usually consider only one exposure or family of exposures.
Objective
This study explores associations between prenatal exposure to a wide range of environmental chemicals and child behaviour.
Methods
We studied 708 mother-child pairs from five European cohorts recruited in 2003–2009. We assessed 47 exposure biomarkers from eight chemical exposure families in maternal blood or urine collected during pregnancy. We used the Strengths and Difficulties Questionnaire (SDQ) to evaluate child behaviour between three and seven years of age. We assessed associations of SDQ scores with exposures using an adjusted least absolute shrinkage and selection operator (LASSO) considering all exposures simultaneously and an adjusted exposome-wide association study (ExWAS) considering each exposure independently.
Results
LASSO selected only copper (Cu) as associated with externalizing behaviour. In the ExWAS, bisphenol A [BPA, incidence rate ratio (IRR): 1.06, 95% confidence interval (95%CI): 1.01;1.12] and mono-n-butyl phthalate (MnBP, IRR: 1.06, 95%CI: 1.00;1.13) were associated with greater risk of externalizing behaviour problems. Cu (IRR: 0.90, 95%CI: 0.82;0.98), perfluoroundecanoate (PFUnDA, IRR: 0.92, 95%CI: 0.84;0.99) and organochlorine compounds (OCs) were associated with lower risk of externalizing behaviour problems, however the associations with OCs were mainly seen among women with insufficient weight gain during pregnancy. Internalizing score worsen in association with exposure to diethyl thiophosphate (DETP, IRR: 1.11, 95%CI: 1.00;1.24) but the effect was driven by the smallest cohort. Internalizing score improved with increased concentration of perfluorooctane sulfonate (PFOS, IRR: 0.92, 95%CI: 0.85;1.00), however the association was driven by the two smallest cohorts with the lowest PFOS concentrations.
Discussion
This study added evidence on deleterious effects of prenatal exposure to BPA and MnBP on child behaviour. Other associations should be interpreted cautiously since they were not consistent with previous studies or they have not been studied extensively.
Keywords: Internal exposome, Prenatal exposure, Child behaviour, Strengths and Difficulties Questionnaire, Birth cohort
Graphical abstract

Highlights
-
•
We studied simultaneous effect of prenatal exposure to several compounds on child behaviour.
-
•
47 exposure biomarkers from 8 chemical exposure families were studied in 5 European cohorts.
-
•
Bisphenol A and mono-n-butyl phthalate were associated with increased behavioural problems in children.
-
•
Copper was associated with decreased behavioural problems.
1. Introduction
Child neurodevelopmental disorders are associated with long-term functional impairments which cause substantial social and financial costs for the affected individuals, their families and society as a whole. The annual cost (including medical and non-medical costs) of child neurodevelopment disorders in Europe has been estimated at €21 billion (Gustavsson et al., 2011). This makes the identification of modifiable risk factors for these disorders a priority target for public health. The root causes of most childhood neurodevelopmental disorders are multifactorial and only partly understood. In addition to genetic factors, exposure to environmental contaminants during periods of high sensitivity of the brain, such as pregnancy and early childhood, is suspected to play a role in the origin of neurodevelopmental disorders (Bellinger, 2009; Grandjean and Landrigan, 2014). In a review focusing on human studies, Grandjean and Landrigan identified 12 environmental chemicals or families of chemicals as neurodevelopmental toxicants (Grandjean and Landrigan, 2006, Grandjean and Landrigan, 2014), including several metals and inorganic compounds (lead, methylmercury, inorganic arsenic, manganese, fluoride), polychlorinated biphenyls (PCBs), some solvents (toluene, ethanol), certain pesticides [organophosphate (OP) pesticides] and polybrominated diphenyl ethers (PBDEs). The authors listed over 200 additional chemicals, including some phthalates, bisphenols, and cotinine, that are potentially neurotoxic in humans based on data from the US National Library of Medicine, the US Agency for Toxic Substances and Disease Registry, and the US Environmental Protection Agency.
With few exceptions (e.g., Braun et al., 2014; Kim et al., 2018; Maitre et al. submitted to journal; Tanner et al., 2020), epidemiological studies analysing the effects of environmental contaminants on child neurodevelopment have considered only one exposure or family of exposures, while in real life individuals are exposed to a wide range of environmental compounds that could simultaneously affect development and health (Haug et al., 2018). Studies considering several exposures simultaneously are needed to improve the understanding of the potential effects of environmental risk factors on neurodevelopmental disorders and ameliorate their prevention (Siroux et al., 2016). The aim of this study was to assess the associations between prenatal exposure to a wide range of environmental chemicals (n = 47) and child behaviour.
2. Methods
2.1. Study design and population
This study is a part of the HELIX project which includes six European mother-child cohorts: Born in Bradford (BiB, UK), Étude des Déterminants Pré et Postnatals du Développement et de la Santé de l'Enfant (EDEN, France), Infancia y Medio Ambiente (INMA, Spain), Kaunas Cohort (KANC, Lithuania), Norwegian Mother, Father and Child Cohort Study (MoBa, Norway) and Mother-Child Cohort in Crete (RHEA, Greece). The study design is described in detail elsewhere (Maitre et al., 2018; Vrijheid et al., 2014). Out of the 1301 children originally included in the HELIX sub-cohort (Maitre et al., 2018; Vrijheid et al., 2014), we relied on a sub-sample of 708 mother-child pairs for which child behaviour was assessed using the Strengths and Difficulties Questionnaire (SDQ) at three to seven years of age (Appendix Fig. 1). Children from the MoBa cohort were not included because the SDQ was not implemented in this group.
2.2. Assessment of prenatal exposure to environmental chemicals
We assessed 54 biomarkers of exposure to a broad spectrum of environmental chemicals (Appendix Table 1, Appendix Table 2). Briefly, in blood we assessed biomarkers of exposure to eight organochlorine compounds (OCs), two PBDEs, five per- and polyfluoroalkyl substances (PFASs) and 15 metals and non-metals (essential and toxic elements). In urine, we assessed biomarkers of exposure to 10 phthalate metabolites, seven phenols, six OP pesticide metabolites, and cotinine. Out of those, we excluded five essential elements not considered to be neurotoxic as well as thallium and diethyl dithiophosphate due to their low frequency of detection (1.5% and 2.1%, respectively). This left 47 biomarkers for further analyses. Methods of biomarker assessment and descriptive statistics and correlation patterns between the biomarkers are described elsewhere (Haug et al., 2018; Tamayo-Uria et al., 2019).
2.3. Behavioural outcomes
We evaluated child behaviour using the SDQ (Goodman, 1997), which was completed by the mothers between three and seven years of child's age. SDQ scores were collected as part of the individual cohort initiatives and harmonized and pooled a posteriori. In this analysis we relied on the combined externalizing and internalizing scores only, since they have been shown to be more consistent across informants (e.g., parents, teachers) and more discriminant with respect to clinical disorders in low-risk community samples, like the one examined in our study, compared to the five sub-scales (Goodman et al., 2010) (Appendix Table 3). Moreover, given our limited sample size and the large number of studied exposure biomarkers, combining the SDQ sub-scales limited the number of performed tests.
2.4. Statistical analysis
We singly imputed biomarker concentrations below the limit of detection using a quantile regression approach for the imputation of left-censored missing data (Nadarajah and Kotz, 2006). We divided urinary biomarker concentrations by creatinine concentration. Haemal lipophilic biomarker concentrations were standardized and expressed in ng/g of total lipids in serum or plasma. Concentrations were then ln-transformed (cotinine) or log2-transformed (all other biomarkers) to approach normality and standardized for the interquartile range (IQR) by dividing biomarker concentration observed for each individual for a given exposure by the IQR calculated for this exposure.
We selected the following adjustment factors based on a priori knowledge: cohort, season of conception, child's sex and age at the SDQ assessment, parity, maternal age and education level, maternal working and active smoking status during pregnancy and maternal pre-pregnancy body mass index (see Appendix Table 4 for details). Missing data for exposure biomarker concentrations (see Appendix Table 5 for details) and adjustment factors were multiply imputed (100 imputed datasets) via a chained equations algorithm (White et al., 2011). To explore the associations between 47 biomarkers and externalizing and internalizing behaviour scores we applied two statistical approaches. First, we used a least absolute shrinkage and selection operator (LASSO) algorithm with log link function. LASSO considers all exposures simultaneously (Tibshirani, 1996) and performs variable selection through estimates' shrinkage (i.e., the lowest regression coefficients corresponding to the least informative predictors are assigned a zero value). We determined the range of penalty parameter λ by maximizing the prediction log-likelihood using 10-fold cross-validation. To prevent overfitting, we defined the optimal λ as the one providing the sparsest model (as measured by the number of nonzero regression coefficients) among those yielding a log-likelihood within one standard error of the maximum log-likelihood (Krstajic et al., 2014). To stabilise estimates, LASSO was fit on each of the 100 imputed datasets and an exposure was retained only if it was selected in at least 50% of runs (Wood et al., 2008). Second, to compare with previous single-pollutant studies, we also performed an exposome-wide association study (ExWAS): we fit a negative binomial regression model on each of the 100 imputed datasets for each exposure biomarker and SDQ score, then aggregated the results using Rubin's rule for multiply imputed data (Patel et al., 2010). To control for multiple comparisons, we applied a family-wise error rate (FWER) correction to the p value threshold. The correction uses a Bonferroni procedure extended to handle correlated tests: the actual number of exposures being tested (M) is replaced by a smaller value called the effective number of independent exposures (Me). Me is estimated by ∑i=1M[I(λi > 1)(λi − 1)], where I(x) is an indicator function and λi are the eigenvalues of the matrix of correlations between M exposures. The p value threshold to control FWER to α, using Me in a Bonferroni procedure, is then α / Me (adapted from Li et al., 2012).
To test the robustness of the associations between SDQ scores and exposure biomarkers identified by the LASSO (selected in at least 50% of runs) and ExWAS (those with uncorrected p values <0.05) we performed further sensitivity analyses. We evaluated the linearity of the associations using generalized additive model (GAM) with restricted cubic splines function. Then we ran a regression simultaneously adjusted for all biomarkers associated with the SDQ scores in the main ExWAS (p values <0.2). We additionally adjusted our main model for breastfeeding and fish and seafood consumption during pregnancy (since fish and seafood may accumulate persistent organic contaminants and heavy metals). We explored sex-specific effects by adding an interaction term between each biomarker of exposure and child sex and performed an ExWAS restricted to the participants with no missing biomarker concentrations. For the biomarkers associated with the SDQ externalizing score we ran an ExWAS after exclusion of the BiB cohort, as we had noted that children from this population had markedly lower externalizing score (median = 0.5) compared to the other cohorts (medians ≥5, Table 1). Apart from the mentioned analyses, for all measured exposure biomarkers we evaluated the between-cohort heterogeneity of the adjusted association using the I2 statistic (Higgins and Thompson, 2002). We relied on the following threshold for the I2 interpretation: I2 < 0.3: low heterogeneity, 0.3 ≤ I2 < 0.6: moderate heterogeneity, I2 ≥ 0.6: substantial to high heterogeneity (Deeks et al., 2019). Finally, because excessive maternal weight gain during pregnancy could lead to decreased blood concentrations of lipophilic compounds due to their storage in the adipose tissue (Kim et al., 2011; Lee et al., 2014; Verner et al., 2013) and to behavioural problems in the offspring (Pugh et al., 2016), we ran an additional analysis stratified on gestational weight gain for all the biomarkers from the OCs family.
Table 1.
Population characteristics for the mother-child pairs included in the study: overall and by cohort.
| Overall distribution | Cohort-specific distribution |
p value of equality between cohortsa | |||||
|---|---|---|---|---|---|---|---|
| BiB |
EDEN |
INMA |
KANC |
RHEA |
|||
| 46 (6.5%) | 193 (27.3%) | 218 (30.8%) | 83 (11.7%) | 168 (23.7%) | |||
| Season of conception | ·· | ·· | ·· | ·· | ·· | ·· | <0.001 |
| January-March | 208 (29.4%) | 21 (45.7%) | 65 (33.7%) | 47 (21.6%) | 26 (31.3%) | 49 (29.2%) | |
| April-June | 159 (22.5%) | 5 (10.9%) | 41 (21.2%) | 49 (22.5%) | 10 (12.0%) | 54 (32.1%) | |
| July-September | 174 (24.6%) | 11 (23.9%) | 34 (17.6%) | 61 (28.0%) | 29 (34.9%) | 39 (23.2%) | ·· |
| October-December | 164 (23.2%) | 9 (19.6%) | 53 (27.5%) | 61 (28.0%) | 16 (19.3%) | 25 (14.9%) | ·· |
| Missing | 3 (0.4%) | 0 (0.0%) | 0 (0.0%) | 0 (0.0%) | 2 (2.4%) | 1 (0.6%) | ·· |
| Active smoking during pregnancy | ·· | ·· | ·· | ·· | ·· | ·· | <0.001 |
| No | 553 (78.1%) | 35 (76.1%) | 147 (76.2%) | 162 (74.3%) | 77 (92.8%) | 132 (78.6%) | ·· |
| Yes | 145 (20.5%) | 6 (13.0%) | 46 (23.8%) | 54 (24.8%) | 4 (4.8%) | 35 (20.8%) | ·· |
| Missing | 10 (1.4%) | 5 (10.9%) | 0 (0.0%) | 2 (0.9%) | 2 (2.4%) | 1 (0.6%) | ·· |
| Parity | ·· | ·· | ·· | ·· | ·· | ·· | <0.001 |
| Nulliparous | 317 (44.8%) | 20 (43.5%) | 89 (46.1%) | 117 (53.7%) | 27 (32.5%) | 64 (38.1%) | ·· |
| 1 child | 268 (37.9%) | 15 (32.6%) | 70 (36.3%) | 90 (41.3%) | 26 (31.3%) | 67 (39.9%) | ·· |
| ≥ 2 children | 114 (16.1%) | 10 (21.7%) | 34 (17.6%) | 10 (4.6%) | 28 (33.7%) | 32 (19.0%) | ·· |
| Missing | 9 (1.3%) | 1 (2.2%) | 0 (0.0%) | 1 (0.5%) | 2 (2.4%) | 5 (3.0%) | ·· |
| Maternal level of education | ·· | ·· | ·· | ·· | ·· | ·· | <0.001 |
| Primary school | 89 (12.6%) | 18 (39.1%) | 12 (6.2%) | 52 (23.9%) | 2 (2.4%) | 5 (3.0%) | ·· |
| Secondary school | 292 (41.2%) | 8 (17.4%) | 71 (36.8%) | 91 (41.7%) | 32 (38.6%) | 90 (53.6%) | ·· |
| University degree or higher | 317 (44.8%) | 17 (37.0%) | 108 (56.0%) | 74 (33.9%) | 47 (56.6%) | 71 (42.3%) | ·· |
| Missing | 10 (1.4%) | 3 (6.5%) | 2 (1.0%) | 1 (0.5%) | 2 (2.4%) | 2 (1.2%) | ·· |
| Maternal work status | ·· | ·· | ·· | ·· | ·· | ·· | <0.001 |
| Unemployed | 128 (18.1%) | 13 (28.3%) | 31 (16.1%) | 18 (8.3%) | 13 (15.7%) | 53 (31.5%) | ·· |
| Employed | 560 (79.1%) | 22 (47.8%) | 162 (83.9%) | 197 (90.4%) | 68 (81.9%) | 111 (66.1%) | ·· |
| Missing | 20 (2.8%) | 11 (23.9%) | 0 (0.0%) | 3 (1.4%) | 2 (2.4%) | 4 (2.4%) | ·· |
| Maternal pre-pregnancy BMI | ·· | ·· | ·· | ·· | ·· | ·· | <0.001 |
| Underweight | 28 (4.0%) | 0 (0.0%) | 16 (8.3%) | 9 (4.1%) | 1 (1.2%) | 2 (1.2%) | ·· |
| Normal weight | 426 (60.2%) | 13 (28.3%) | 120 (62.2%) | 149 (68.3%) | 29 (34.9%) | 115 (68.5%) | ·· |
| Overweight | 158 (22.3%) | 17 (37.0%) | 39 (20.2%) | 41 (18.8%) | 28 (33.7%) | 33 (19.6%) | ·· |
| Obesity | 87 (12.3%) | 14 (30.4%) | 16 (8.3%) | 19 (8.7%) | 23 (27.7%) | 15 (8.9%) | ·· |
| Missing | 9 (1.3%) | 2 (4.3%) | 2 (1.0%) | 0 (0.0%) | 2 (2.4%) | 3 (1.8%) | ·· |
| Gestational weight gain based on maternal pre-pregnancy BMIb | ·· | ·· | ·· | ·· | ·· | ·· | <0.001 |
| Insufficient | 186 (26.3%) | 7 (15.2%) | 51 (26.4%) | 76 (34.9%) | 14 (16.9%) | 38 (22.6%) | ·· |
| Adequate | 199 (28.1%) | 10 (21.7%) | 63 (32.6%) | 62 (28.4%) | 14 (16.9%) | 50 (29.8%) | ·· |
| Excessive | 263 (37.1%) | 10 (21.7%) | 59 (30.6%) | 74 (33.9%) | 45 (54.2%) | 75 (44.6%) | ·· |
| Missing | 60 (8.5%) | 19 (41.3%) | 20 (10.4%) | 6 (2.7%) | 10 (12.0%) | 5 (3.0%) | ·· |
| Child sexc | ·· | ·· | ·· | ·· | ·· | ·· | 0.860 |
| Female | 313 (44.2%) | 18 (39.1%) | 83 (43.0%) | 102 (46.8%) | 35 (42.2%) | 75 (44.6%) | ·· |
| Male | 395 (55.8%) | 28 (60.9%) | 110 (57.0%) | 116 (53.2%) | 48 (57.8%) | 93 (55.4%) | ·· |
| Missing | 0 (0.0%) | 0 (0.0%) | 0 (0.0%) | 0 (0.0%) | 0 (0.0%) | 0 (0.0%) | ·· |
| Child age at SDQ assessment (years)c | 5.6 [4.2;6.4] | 5.4 [5.1;5.5] | 5.6 [5.5;5.7] | 6.8 [6.5;6.9] | 4.5 [4.1;4.9] | 4.1 [4.1;4.2] | <0.001 |
| Missing | 0 (0.0%) | 0 (0.0%) | 0 (0.0%) | 0 (0.0%) | 0 (0.0%) | 0 (0.0%) | ·· |
| Maternal age (years) | 30.9 [27.7;34.1] | 29.5 [22.2;34.0] | 30.0 [27.6;34.0] | 32.1 [29.5;34.7] | 29.8 [26.8;32.7] | 31.0 [27.3;34.0] | <0.001 |
| Missing | 4 (0.6%) | 0 (0.0%) | 0 (0.0%) | 0 (0.0%) | 2 (2.4%) | 2 (1.2%) | ·· |
| SDQ externalizing scorec | 5.0 [2.8;7.0] | 0.5 [0.0;3.8] | 5.0 [2.0;7.0] | 5.0 [3.0;8.0] | 6.0 [4.0;8.5] | 5.0 [3.0;7.0] | <0.001 |
| Missing | 0 (0.0%) | 0 (0.0%) | 0 (0.0%) | 0 (0.0%) | 0 (0.0%) | 0 (0.0%) | ·· |
| SDQ internalizing scorec | 3.0 [1.0;5.0] | 2.0 [0.0;4.0] | 3.0 [1.0;5.0] | 3.0 [1.0;4.8] | 3.0 [2.0;5.0] | 3.0 [1.0;4.0] | 0.012 |
| Missing | 0 (0.0%) | 0 (0.0%) | 0 (0.0%) | 0 (0.0%) | 0 (0.0%) | 0 (0.0%) | ·· |
Distributions are reported as number and percentage for categorical variables and as median, 1st and 3rd quartiles for continuous variables. All values are before imputation.
Kruskal-Wallis test was applied on continuous variables and χ² or exact Fisher test was applied on categorical variables.
Gestational weight gain based on maternal pre-pregnancy BMI was categorized into 3 categories: insufficient, adequate and excessive according to the recommendations of the US Institute of Medicine (Institute of Medicine (US) and National Research Council (US) Committee to Reexamine IOM Pregnancy Weight Guidelines 2009). For BMI < 18.5 kg/m2 recommended total weight gain was 12.5-18.0 kg, for BMI = 18.5-24.9 kg/m2: 11.5-16.0 kg, for BMI = 25.0-29.9 kg/m2: 7.0-11.5 kg and for BMI ≥ 30.0 kg/m2 recommended weight gain was 5.0-9.0 kg.
Child sex, child age at the SDQ assessment and SDQ scores were not imputed. Abbreviations: BiB = Born in Bradford. EDEN = Étude des Déterminants Pré et Postnatals du Développement et de la Santé de l’Enfant. INMA = Infancia y Medio Ambiente. KANC = Kaunas Cohort. RHEA = Mother-Child Cohort in Crete. BMI = body mass index. SDQ = Strengths and Difficulties Questionnaire.
All analyses were conducted using R v. 4.0.2 (R Core Team and R Foundation for Statistical Computing, 2020) and RStudio v. 1.3.1056 (RStudio Team, 2020) using packages: mice (van Buuren and Groothuis-Oudshoorn, 2011) for multiple imputation, mpath (Wang et al., 2015) to fit LASSO, MASS (Venables and Ripley, 2002) for the ExWAS analysis, metaplus (Beath, 2016) to estimate between-cohort heterogeneity and gam (Hastie, 2020) and rms (Harrell Jr, 2020) to evaluate linearity of associations between biomarkers of exposure and SDQ scores.
Data used in this study is confidential and can only be provided upon request and after approval of the HELIX consortium. The code is available in the public repository of the Team of Environmental Epidemiology applied to Reproduction and Respiratory Health (https://gricad-gitlab.univ-grenoble-alpes.fr/iab-env-epi).
3. Results
3.1. Characteristics of the study population and prenatal exposure to environmental contaminants
Characteristics of the study population and exposure biomarker distributions are detailed in Table 1 and Appendix Table 5, respectively. Median child age at the SDQ assessment was 5.6 years. Median SDQ externalizing and internalizing scores were 5 and 3 points, respectively. Heterogeneity was observed between cohorts for most covariates as well as for the SDQ scores, with parents from the BiB cohort reporting behaviour scores of their children to be better than of those from other cohorts (p value of the Kruskal-Wallis test <0.001, Table 1). High frequency of detection was observed for most of the 47 exposure biomarkers, with 39 detected in at least 89% of the tested samples (Appendix Table 5). Heterogeneity was observed between cohorts for most exposures (p values of the Kruskal-Wallis test <0.05, Appendix Table 5).
3.2. Association between prenatal chemical exposome and SDQ scores
3.2.1. Externalizing score
Among the 47 exposures studied, the adjusted LASSO for the externalizing score selected only copper (Cu). Cu was also detected in the ExWAS analysis as associated with lower externalizing score, meaning decreased risk of behavioural problems [Incidence rate ratio (IRR): 0.90, 95% confidence interval (CI): 0.82;0.98 for an IQR change in the log2-transformed Cu concentration, Table 2]. In addition to Cu, the ExWAS identified five other associations. Bisphenol A (BPA, IRR: 1.06, 95%CI: 1.01;1.12) and mono-n-butyl phthalate (MnBP, IRR: 1.06, 95%CI: 1.00;1.13) were positively associated with the externalizing score, while perfluoroundecanoate (PFUnDA, IRR: 0.92, 95%CI: 0.84;0.99) and two OCs [dichlorodiphenyltrichloroethane (DDT, IRR: 0.92, 95%CI: 0.84;1.00) and PCB-138 (IRR: 0.88, 95%CI: 0.79;0.99)] were negatively associated with this score. While not significant (p values ranged between 0.065 for PCB-153 to 0.253 for PCB-180), all the other compounds from the OCs family tended to be negatively associated with the externalizing score (Appendix Table 6).
Table 2.
Adjusted associationsa between the prenatal exposure to environmental contaminants and SDQ externalizing and internalizing scores (n = 708 unless stated otherwise).
| Behavioural outcome | Exposure | Exposure family | ExWASa |
Model simultaneously adjusted for coexposuresb |
ExWAS for complete case analysis |
ExWAS after exclusion of the BiB cohortc |
|||||||
|---|---|---|---|---|---|---|---|---|---|---|---|---|---|
| IRR (95%CI)d | p value | FWER p value |
IRR (95%CI)d | p value | IRR (95%CI)d | p value | n | IRR (95%CI)d | p value | n | |||
| SDQ externalizing score | BPA (μg/g of creatinine) | Phenol | 1.06 (1.01; 1.12) | 0.028 | 0.842 | 1.05 (0.99; 1.11) | 0.105 | 1.07 (1.01; 1.13) | 0.013 | 580 | 1.06 (1.01; 1.12) | 0.026 | 662 |
| Cu (μg/L of whole blood) | Essential element | 0.90 (0.82; 0.98) | 0.021 | 0.631 | 0.90 (0.82; 0.99) | 0.030 | 0.92 (0.85; 0.99) | 0.031 | 314 | 0.91 (0.83; 1.00) | 0.042 | 662 | |
| DDT (ng/g of lipids) | Organochlorine compound | 0.92 (0.84; 1.00) | 0.045 | 1 | 0.94 (0.85; 1.03) | 0.163 | 0.87 (0.79; 0.97) | 0.008 | 356 | 0.94 (0.86; 1.03) | 0.174 | 662 | |
| MnBP (μg/g of creatinine) | Phthalate | 1.06 (1.00; 1.13) | 0.048 | 1 | 1.06 (1.00; 1.13) | 0.058 | 1.07 (1.00; 1.14) | 0.046 | 585 | 1.06 (1.00; 1.13) | 0.041 | 662 | |
| PCB-138 (ng/g of lipids) | Organochlorine compound | 0.88 (0.79; 0.99) | 0.035 | 1 | 0.95 (0.82; 1.11) | 0.539 | 0.86 (0.75; 0.98) | 0.030 | 567 | 0.88 (0.79; 0.99) | 0.031 | 662 | |
| PFUnDA (μg/L of serum, plasma or whole blood) | Perfluoroalkyl substance | 0.92 (0.84; 0.99) | 0.034 | 1 | 0.94 (0.87; 1.02) | 0.164 | 0.95 (0.87; 1.03) | 0.212 | 447 | 0.90 (0.82; 0.98) | 0.013 | 662 | |
| SDQ internalizing score | DETP (μg/g of creatinine) | OP pesticide metabolite | 1.11 (1.00; 1.24) | 0.053 | 1 | 1.11 (0.99; 1.23) | 0.067 | 1.09 (0.97; 1.23) | 0.141 | 560 | |||
| PFOS (μg/L of serum, plasma or whole blood) | Perfluoroalkyl substance | 0.92 (0.85; 1.00) | 0.037 | 1 | 0.94 (0.81; 1.08)s | 0.381 | 0.93 (0.86; 1.01) | 0.091 | 646 | ||||
Only associations with uncorrected p values < 0.05 (except for DETP with the p value = 0.053) in the main ExWAS are displayed in this table.
Results from a multiple linear regression model including all exposures with p value < 0.2 in the main ExWAS. Due to the high correlation with PCB-138 (Spearman's rho = 0.97, variation inflation factor = 18.7), PCB-153 was excluded from the SDQ externalizing coexposure. The models adjusted for coexposures included 13 biomarkers for the SDQ externalizing score (BPA, Cd, Co, Cu, DDE, DDT, HCB, MnBP, PBDE-47, PCB-118, PCB-138, PFUnDA and PRPA) and 8 for the SDQ internalizing score (BUPA, Co, DETP, Mn, PFHxS, PFNA, PFOS and PFUnDA). In addition to the mentioned biomarkers, regression models were adjusted for cohort, season of conception, child sex and age at SDQ assessment, parity, maternal: education level, work status, age, pre-pregnancy BMI, and prenatal active smoking status.
The analysis was performed only for the SDQ externalizing score.
IRRs are reported with 95%CIs and correspond to the change in the probability of the SDQ scores increasing by one unit for an IQR change in the log2 of the biomarker concentration in maternal blood or urine. Abbreviations: BiB = Born in Bradford. BMI = body mass index. CI = confidence interval of the IRR estimate. ExWAS = exposome-wide association study. FWER = family wise error rate adjustment. IQR = inter-quartile range. IRR = incident rate ratio. SDQ = Strengths and Difficulties Questionnaire. BPA = bisphenol A. BUPA = n-butyl paraben. Cd = cadmium. Co = cobalt. Cu = copper. DDE = dichlorodiphenyldichloroethylene. DDT = dichlorodiphenyltrichloroethane. DETP = diethyl thiophosphate. HCB = hexachlorobenzene. Mn = manganese. MnBP = mono-n-butyl phthalate. OP = organophosphate. PBDE-47 = polybrominated diphenyl ether-47. PCB = polychlorinated biphenyl. PFHxS = perfluorohexane sulfonate. PFNA = perfluorononanoate. PFOS = perfluorooctane sulfonate. PFUnDA = perfluoroundecanoate. PRPA = propyl paraben.
3.2.2. Internalizing score
The adjusted LASSO did not retain any exposure biomarker as being associated with the internalizing score, while the ExWAS identified a positive association with diethyl thiophosphate (DETP) concentration close to the significance level (IRR: 1.11, 95%CI: 1.00;1.24) and a negative association with perfluorooctane sulfonate concentration (PFOS, IRR: 0.92, 95%CI: 0.85;1.00, Table 2 and Appendix Table 7).
3.2.3. Sensitivity analyses
After correction for multiple testing (corrected p value of 0.0017), none of the exposure-SDQ score associations passed the significance threshold. All exposure-SDQ score associations detected in our main analysis were linear (Appendix Fig. 2). Compared to the main ExWAS where each exposure biomarker was studied separately, adjustment for coexposures (i.e., exposures associated with the SDQ scores with a p value below 0.2) led to similar effect estimates except for PCB-138 (IRR: 0.95, 95%CI: 0.82;1.11) and PFOS (IRR: 0.94, 95%CI: 0.81;1.08) for which the negative association with SDQ scores was attenuated and the confidence intervals widened (Table 2). Effect estimates for analyses additionally adjusted for fish and seafood consumption (not shown) and breastfeeding (not shown) were similar to those observed in the main analysis. For the complete case analysis, while the effect estimates were similar to those of our main analysis, their confidence intervals were wider and the p values increased (e.g., p value = 0.212 and 0.141 for PFUnDA and DETP, respectively), likely because of the smaller sample size (n ranged from 314 for Cu to 646 for PFOS). No interactions with child's sex were detected for the associations highlighted in our main analysis (lowest p value for an interaction was 0.28 for DDT). Exclusion of the BiB cohort (new sample size n = 662, Table 2) did not strongly affect our results for the SDQ externalizing score, except of widening of the confidence interval for DDT (IRR: 0.92, 95%CI: 0.84;1.00 for the main ExWAS and IRR: 0.94, 95%CI: 0.86;1.03 after BiB cohort exclusion). We observed low heterogeneity across cohorts (I2 < 0.001) for most exposure-SDQ score associations (Fig. 1, Appendix Table 6, Appendix Table 7), except for BPA (I2 = 0.348, association mainly observed in EDEN and RHEA cohorts), DDT (I2 = 0.417, association mainly observed in BiB and EDEN cohorts), DETP (I2 = 0.612) and PFOS (I2 = 0.569). For PFOS, the association was driven by BiB and KANC, the two cohorts with the smallest sample size (n = 46 and 83 for BiB and KANC, respectively) and the lowest median value for PFOS concentration. Similarly, the association between DETP and SDQ internalizing score was mainly observed in BiB, the cohort with the smallest sample size. For the lipophilic compounds from the OCs family, stratification for gestational weight gain showed that the negative association was mainly observed among women with insufficient weight gain (Fig. 2).
Fig. 1.

Sensitivity analysis (n = 708. BiB n = 46; EDEN n = 193; INMA n = 218; KANC n = 83; RHEA n = 168).
Cohort-specific associations between prenatal exposures and SDQ externalizing (A) and internalizing (B) scores detected by the ExWAS (p value of association <0.05 except of diethyl thiophosphate for which the p value = 0.053). Regression models were adjusted for cohort, season of conception, child sex and age at SDQ assessment, parity, maternal: education level, work status, age, pre-pregnancy BMI and prenatal active smoking status. The “All cohorts” estimates are those obtained in the main ExWAS. IRRs are reported with 95%CIs and correspond to the change in the probability of the SDQ scores increasing by one unit for an IQR change in the log2 of the biomarker concentration in maternal blood or urine. We relied on the following threshold for I2 interpretation: I2 < 0.3 low heterogeneity, 0.3 ≤ I2 < 0.6 moderate heterogeneity, I2 ≥ 0.6 substantial to high heterogeneity. The black squares display the IRRs (size of the square reflects the relative size of each cohort) and the horizontal lines their 95%CIs. Abbreviations: BiB = Born in Bradford. EDEN = Étude des Déterminants Pré et Postnatals du Développement et de la Santé de l'Enfant. INMA = Infancia y Medio Ambiente. KANC = Kaunas Cohort. RHEA = Mother-Child Cohort in Crete. CI = confidence interval of the IRR estimate. ExWAS = exposome-wide association study. IQR = inter-quartile range. IRR = incidence rate ratio. BMI = body mass index. SDQ = Strengths and Difficulties Questionnaire.
Fig. 2.
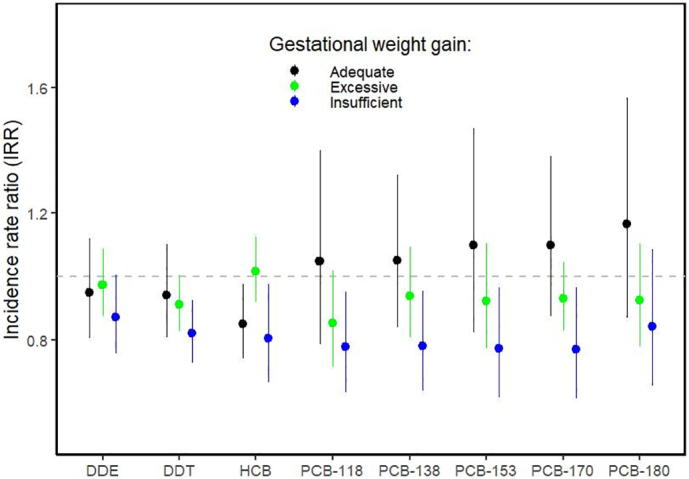
Sensitivity analysis for exposure-SDQ externalizing score associations stratified on gestational weight gain.
We stratified on three categories of gestational weight gain as defined in the revised recommendations of the US Institute of Medicine (Institute of Medicine (US) and National Research Council (US) Committee to Reexamine IOM Pregnancy Weight Guidelines 2009): adequate (in black), excessive (in green) and insufficient (in blue). For pre-pregnancy BMI < 18.5 kg/m2 recommended total weight gain was 12.5–18.0 kg, for BMI = 18.5–24.9 kg/m2: 11.5–16.0 kg, for BMI = 25.0–29.9 kg/m2: 7.0–11.5 kg and for BMI ≥ 30.0 kg/m2 recommended weight gain was 5.0–9.0 kg. We ran one negative binomial regression model per exposure and outcome for each sub-population. IRRs are reported with 95%CIs and correspond to the change in the probability of the SDQ scores increasing by one unit for an IQR change in the log2 of the biomarker concentration in maternal blood. Each point represents the IRR estimate and the vertical line its 95%CI. Regression models were adjusted for cohort, season of conception, child sex and age at SDQ assessment, parity, and maternal factors: education level, work status, age and prenatal active smoking status. Abbreviations: BMI = body mass index. CI = confidence interval of the IRR estimate. IQR = inter-quartile range. IRR = incidence rate ratio. SDQ = Strengths and Difficulties Questionnaire. DDE = dichlorodiphenyldichloroethylene. DDT = dichlorodiphenyltrichloroethane. HCB = hexachlorobenzene. PCB = polychlorinated biphenyl. (For interpretation of the references to colour in this figure legend, the reader is referred to the web version of this article.)
4. Discussion
Among the 47 exposures tested, only seven were associated (uncorrected p values <0.05) with either externalizing or internalizing SDQ score in children between three and seven years of age. Association with one additional exposure biomarker was close to significance (uncorrected p value = 0.053). Cautious interpretation of the results is required since none passed the significance threshold after the FWER correction of the p values obtained in the ExWAS. For this reason, in the discussion we focused on the associations that were detected by both the LASSO and the ExWAS or that were consistent with previous human literature. The other associations should be treated as hypothesis generating.
Cu was detected by LASSO and by ExWAS as negatively associated with SDQ externalizing score, suggesting lower risk of behavioural problems. Cu is essential for many biological processes, including brain development during the foetal period (Scheiber et al., 2014), and an excess or insufficiency of Cu may lead to health problems (Gaetke et al., 2014). Our finding of a negative association between Cu and SDQ score (suggesting decreased risk of behavioural problems) needs to be replicated as, to our knowledge, the only study that assessed prenatal Cu and externalizing behaviour relied on the older children of the HELIX cohort (6–11 years) and did not report any effect (IRR: 1.00, 95%CI: 0.91;1.09, (Maitre et al. submitted to journal)). Cu concentrations in our study population (geometric mean = 1440 μg/L of blood, 95%CI: 1410;1471) were slightly higher than those reported among non-pregnant females in the most recent US NHANES study (geometric mean = 1270 μg/L, 95%CI: 1240;1300, Centers for Disease Control and Prevention, 2019). However, this may be due to the fact that serum Cu concentrations tend to increase during pregnancy (Vukelic et al., 2012).
Prenatal BPA urinary concentration was associated with higher (worse) scores on the externalizing behaviour sub-scale. Such association has also been suggested by another study assessing behaviour at older age on a similar population (IRR: 1.07, 95%CI: 0.99;1.16, Maitre et al. submitted to journal), suggesting that the association we observed between three and seven years of age might persist when the children get older. Previous studies coherently reported positive associations between prenatal BPA and externalizing behaviour scores (Braun et al., 2009, Braun et al., 2017b; Evans et al., 2014; Li et al., 2020; Perera et al., 2012; Philippat et al., 2017; Roen et al., 2015; Stacy et al., 2017) or the hyperactivity-inattention score (Casas et al., 2015), an item included in our externalizing SDQ score sub-scale. All the mentioned studies, except for those relying on the HOME mother-child cohort (Braun et al., 2009, Braun et al., 2017b; Stacy et al., 2017), reported these associations among boys, while we did not observe a sex-specific effect. Previous studies also reported higher scores on the internalizing behaviour sub-scale in association with the prenatal exposure to bisphenol A (Braun et al., 2011, Braun et al., 2017a; Evans et al., 2014; Grohs et al., 2019; Harley et al., 2013; Li et al., 2020; Perera et al., 2012, Perera et al., 2016; Philippat et al., 2017; Roen et al., 2015). While not significant (p value = 0.21), effect estimate for our study population also suggested a positive association between BPA and internalizing SDQ score (IRR: 1.04, 95%CI: 0.98;1.12). The animal research literature is also consistent here: numerous studies in rodents have reported a link between exposure to BPA and behaviour (Anderson et al., 2013; Ishido et al., 2011; Komada et al., 2014; Nakagami et al., 2009; Palanza et al., 2008; Rochester et al., 2018; Tian et al., 2010). Moreover, in vitro and in vivo studies provide evidence that BPA can affect biological pathways crucial for normal brain development by binding oestrogen receptors or interacting with the thyroid hormone and hypothalamic-pituitary-adrenal axis (Mustieles et al., 2015; Mustieles and Fernández, 2020; Nesan et al., 2018).
Maternal urinary MnBP concentration was associated with worse externalizing behaviour score. MnBP is a metabolite of dibutyl phthalate (DBP), a compound that exerts anti-androgenic activity (National Academies of Sciences, Engineering, and Medicine, 2017). Two previous human studies of prenatal MnBP concentration and child behaviour reported an association with externalizing behaviour among boys (Engel et al., 2010; Lien et al., 2015) and one reported an association with conduct problems, an item included in our externalizing behaviour sub-scale (Kobrosly et al., 2014). Other studies reported associations with other components of child behaviour (i.e., internalizing behaviour, Philippat et al., 2017; Whyatt et al., 2012) or no association for this phthalate metabolite (Engel et al., 2018; Gascon et al., 2015; Minatoya et al., 2018). Experimental studies in rodents also support a behavioural effect of MnBP (Farzanehfar et al., 2016; Hoshi and Ohtsuka, 2009; Yan et al., 2016). The heterogeneity of the epidemiological literature supports further investigation of the potential effect of MnBP on child behaviour.
DETP, a nonspecific dialkyl phosphate (DAP) metabolite, was the only OP pesticide metabolite associated with worse internalizing behaviour score. This association was on the verge of significance and showed a substantial heterogeneity between the cohorts. Moreover, maternal DETP concentration was the lowest among the OP pesticide metabolite family. OP pesticides are neurotoxic and there are several studies pointing towards the deleterious associations between prenatal concentrations of their metabolites and neurodevelopment in humans (reviewed in Sapbamrer and Hongsibsong, 2019; and Tessari et al., 2020). Nevertheless, few epidemiological studies have explored their potential effects on child behaviour. Results for the CHAMACOS cohort relying on the Child Behaviour Checklist suggested that the molar sum of DAP metabolites was associated with attention problems at five years (Marks et al., 2010) but not at earlier age (Eskenazi et al., 2007, Eskenazi et al., 2010). Another study found no link between DETP prenatal exposure and child behaviour (van den Dries et al., 2019). Our study is among the first ones to report the effect of prenatal exposure to DETP on child behaviour and, since the result was driven by the cohort with the smallest sample size (BiB, n = 46), it needs to be replicated.
DDT and PCB-138 were associated with lower SDQ externalizing scores, suggesting a protective effect on behaviour. Our sensitivity analysis showed that these protective effects were mainly seen among women with insufficient weight gain during pregnancy. Similar patterns of associations were observed for other compounds from the OCs family. Excessive gestational weight gain has been associated with both lower blood concentrations of lipophilic compounds (such as OCs) due to their storage in fat tissue (Lee et al., 2017), and with higher risk of behavioural problems in children (Pugh et al., 2016). However, since previous studies did not report protective effects for DDT and PCBs on child behaviour (Forns et al., 2016; Rosenquist et al., 2017) the associations we observed between OCs and SDQ scores should be interpreted with caution.
We found a negative association between two PFASs (PFOS and PFUnDA) and child behaviour. The association with PFOS was only observed in the two cohorts with the smallest sample size (BiB and KANC with n = 46 and 83, respectively) and the lowest median PFOS concentrations. The association with PFOS was not expected as previous human studies reported either increased behavioural problems linked to this exposure (Høyer et al., 2015) or no association at all (Fei and Olsen, 2011; Forns et al., 2015). The negative association between PFUnDA and child behaviour was also observed among older children of the HELIX cohorts (IRR: 0.89, 95%CI: 0.80;0.98, Maitre et al. submitted to journal) and needs further investigation.
5. Strengths and limitations
Our study is among the first to simultaneously consider a large number of exposures (n = 47) from multiple families in relation to externalizing and internalizing behaviour scores in children. Its strengths include the longitudinal design, which allows prospectively assessing exposure during pregnancy (a critical period for brain development), and the use of a standardized tool (SDQ) to evaluate child behaviour. We relied on two complementary statistical approaches: ExWAS produces effect estimates that are comparable to previous studies and can be used in meta-analyses, while LASSO considers all exposures simultaneously, performs variable selection, and is on average less likely to generate false positives (spurious associations) than ExWAS (Barrera-Gómez et al., 2017). Moreover, we investigated potential coexposure confounding: the associations for BPA, Cu, DDT, DETP, MnBP and PFUnDA remained after adjusting for other exposures. Finally, relying on five cohorts with differing confounding structure (e.g., women from the BiB cohort had overall lower education levels) might improve causal inference: an association seen in multiple heterogeneous cohorts is less likely to result from residual confounding than an association seen in only one or a few homogenous cohorts (Richmond et al., 2014). On the other hand, since the cohorts were recruited before the start of the HELIX project, collection of biological samples during pregnancy was not harmonized leading to different timings (i.e., different trimester) for exposure assessment across cohorts. Additionally, for some cohorts the same exposure biomarker was sometimes assessed by different laboratories (see Appendix Table 2), which may partly explain the between-cohort heterogeneity of the results observed for some exposures. This should not have a strong impact on our results since the interlaboratory comparisons performed in the framework of the HELIX protocol suggested a high correlation between assessments performed in different laboratories. For instance, correlation coefficients between phenol urinary concentrations measured by the Norwegian Institute of Public Health and Centers for Disease Control and Prevention in 12 maternal samples of the EDEN cohort were ≥ 0.90 (Supplementary of Tamayo-Uria et al., 2019). Due to limited availability of biological samples, some biomarkers of exposure were not assessed in all cohorts (e.g., metals and semi-metals were not assessed in INMA, see Appendix Table 5 for details). We used multiple imputation on the missing values as it has been shown to generate less bias than exclusion of a variable or a stratum (e.g., exclusion of an entire cohort for which an exposure biomarker concentration was fully missing, Held et al., 2016; Jolani et al., 2015). Nevertheless, for the exposures with many missing values (metals, PBDEs) multiple imputation may have widened the confidence intervals of our effect estimates, limiting the ability to detect associations. Moreover, we relied on spot urine samples to assess exposure to compounds whose urinary concentration has moderate to high intra-individual variability during pregnancy (reviewed by Casas et al., 2018). This can potentially lead to exposure misclassification, attenuation bias and power reduction (Perrier et al., 2016). It has been shown that the measurement error and resulting attenuation of the effect estimates varies across exposures (exposures with the most intra-individual variability have the highest errors, Perrier et al., 2016). Therefore, we must be cautious when comparing exposure-SDQ associations across exposures with differing intra-individual variability. We decided not to assess all possible second-order interactions between exposures because, given our limited sample size and large number of exposures, it could have substantially decreased the power and increased the false positive rate (Barrera-Gómez et al., 2017). Finally, we focused only on prenatal exposure and did not assess exposure in early postnatal life, a period also recognized as crucial for brain development.
6. Conclusion
In line with previous epidemiological studies, our results suggested a deleterious association between prenatal exposure to bisphenol A, MnBP (a metabolite of DBP) and child behaviour. According to the toxicological literature, the association observed for BPA is biologically plausible. DETP was also associated with worse behavioural scores, however this result should be interpreted with caution since it was driven by the smallest cohort. Cu, DDT, PCB-138, PFOS and PFUnDA were associated with lower risk of behavioural problems. These associations were not reported previously and for lipophilic compounds (DDT and PCB-138) could even result from changes in body composition during pregnancy.
Funding/Support
P. Jedynak was funded by the French National Research Agency in the framework of the Investissements d'Avenir program (ANR-15-IDEX-02). J. Julvez holds the Miguel Servet-II contract (CPII19/00015) awarded by the Instituto de Salud Carlos III (co-funded by the European Social Fund “Investing in your future”). The study has received funding from the European Community's Seventh Framework Programme (FP7/2007–2013) under grant agreement no 308333 for the HELIX project. The present work relied on data from five out of six HELIX cohorts that received funding previously. INMA study data collection was supported by grants from the Instituto de Salud Carlos III, CIBERESP and the Generalitat de Catalunya-CIRIT (Spain). KANC study was funded by the grant of the Lithuanian Agency for Science Innovation and Technology (6-04-2014-31V-66). The RHEA study was financially supported by European projects and the Greek Ministry of Health and Social Solidarity (Program of Prevention of obesity and neurodevelopmental disorders in preschool children, in Heraklion district, Crete, Greece: 2011–2014; “Rhea Plus”: Primary Prevention Program of Environmental Risk Factors for Reproductive Health and Child Health: 2012–2015). Core support for BiB study was provided by the Wellcome Trust (WT101597MA, UK). EDEN study was supported by grants from Foundation for Medical Research (FRM), Inserm, French Institute for Public Health Research (IReSP), Nestlé, French Ministry of Social Affairs and Health, French National Research Agency (ANR), Université Paris-Sud, French Institute for Public Health Surveillance (InVS), French Agency for Food, Environmental and Occupational Health & Safety (ANSES) and Mutuelle générale de l'Education nationale (MGEN).
Role of the funder/sponsor
The funding sources had no role in any of: the design and conduct of the study; collection, management, analysis, and interpretation of the data; preparation, review or approval of the manuscript; decision to submit the manuscript for publication.
CRediT authorship contribution statement
Jedynak had full access to all the data in the study and takes responsibility for the integrity of the data and the accuracy of the data analysis.
Study concept and design: Vrijheid.
Supervision of all aspects of study design and data collection: Vrijheid.
Cohort data collection: Gützkow, Guxens, Casas, McEachan, Gražulevičienė, Chatzi, Kampouri, Vafeiadi, Vrijheid, Slama, Mon-Williams, Wright.
Acquisition, analysis, or interpretation of data: Jedynak, Philippat, Julvez, López-Vicente, Tamayo, Sunyer, Casas, Thomsen, Vrijheid, Maitre.
Drafting of the manuscript: Jedynak, Philippat.
Statistical analysis: Jedynak, Basagaña, Philippat.
Obtained funding: Thomsen, Slama, Chatzi, Wright, Gražulevičienė, Vrijheid.
Technical or material support: Urquiza.
Study supervision: Philippat.
All authors have read, commented on and approved the manuscript.
Declaration of competing interest
The authors declare that they have no known competing financial interests or personal relationships that could have appeared to influence the work reported in this paper.
Acknowledgements
We are grateful to all the participating children, parents, practitioners and researchers in the five countries who took part in this study.
Editor: Wei Huang
Footnotes
Supplementary data to this article can be found online at https://doi.org/10.1016/j.scitotenv.2020.144115.
Appendix A. Supplementary data
Supplementary material
References
- Anderson O.S., Peterson K.E., Sanchez B.N., Zhang Z., Mancuso P., Dolinoy D.C. Perinatal bisphenol a exposure promotes hyperactivity, lean body composition, and hormonal responses across the murine life course. FASEB J. 2013;27:1784–1792. doi: 10.1096/fj.12-223545. 23345456 [DOI] [PMC free article] [PubMed] [Google Scholar]
- Barrera-Gómez J., Agier L., Portengen L., Chadeau-Hyam M., Giorgis-Allemand L., Siroux V. A systematic comparison of statistical methods to detect interactions in exposome-health associations. Environ. Health. 2017;16 doi: 10.1186/s12940-017-0277-6. 28709428 [DOI] [PMC free article] [PubMed] [Google Scholar]
- Beath K J. 2016. Metaplus: an R package for the analysis of robust meta-analysis and meta-regression. R J 8:5; doi: 10.32614/RJ-2016-001. [DOI]
- Bellinger D.C. Interpreting epidemiologic studies of developmental neurotoxicity: conceptual and analytic issues. Neurotoxicol. Teratol. 2009;31:267–274. doi: 10.1016/j.ntt.2009.06.006. 19595760 [DOI] [PubMed] [Google Scholar]
- Braun J.M., Yolton K., Dietrich K.N., Hornung R., Ye X., Calafat A.M. Prenatal bisphenol a exposure and early childhood behavior. Environ. Health Perspect. 2009;117:1945–1952. doi: 10.1289/ehp.0900979. 20049216 [DOI] [PMC free article] [PubMed] [Google Scholar]
- Braun J.M., Kalkbrenner A.E., Calafat A.M., Yolton K., Ye X., Dietrich K.N. Impact of early-life bisphenol a exposure on behavior and executive function in children. Pediatrics. 2011;128:873–882. doi: 10.1542/peds.2011-1335. 22025598 [DOI] [PMC free article] [PubMed] [Google Scholar]
- Braun J.M., Kalkbrenner A.E., Just A.C., Yolton K., Calafat A.M., Sjödin A. Gestational exposure to endocrine-disrupting chemicals and reciprocal social, repetitive, and stereotypic behaviors in 4- and 5-year-old children: the HOME study. Environ. Health Perspect. 2014;122:513–520. doi: 10.1289/ehp.1307261. 24622245 [DOI] [PMC free article] [PubMed] [Google Scholar]
- Braun J.M., Muckle G., Arbuckle T., Bouchard M.F., Fraser W.D., Ouellet E. Associations of prenatal urinary bisphenol a concentrations with child behaviors and cognitive abilities. Environ. Health Perspect. 2017;125 doi: 10.1289/EHP984. 28657891 [DOI] [PMC free article] [PubMed] [Google Scholar]
- Braun J.M., Yolton K., Stacy S.L., Erar B., Papandonatos G.D., Bellinger D.C. Prenatal environmental chemical exposures and longitudinal patterns of child neurobehavior. Neurotoxicology. 2017;62:192–199. doi: 10.1016/j.neuro.2017.07.027. 28736150 [DOI] [PMC free article] [PubMed] [Google Scholar]
- Casas M., Forns J., Martínez D., Avella-García C., Valvi D., Ballesteros-Gómez A. Exposure to bisphenol a during pregnancy and child neuropsychological development in the INMA-Sabadell cohort. Environ. Res. 2015;142:671–679. doi: 10.1016/j.envres.2015.07.024. 26343751 [DOI] [PubMed] [Google Scholar]
- Casas M., Basagaña X., Sakhi A.K., Haug L.S., Philippat C., Granum B. Variability of urinary concentrations of non-persistent chemicals in pregnant women and school-aged children. Environ. Int. 2018;121:561–573. doi: 10.1016/j.envint.2018.09.046. 30300814 [DOI] [PubMed] [Google Scholar]
- Centers for Disease Control and Prevention . Updated Tables; Volume One: 2019. Fourth National Report on Human Exposure to Environmental Chemicals. [Google Scholar]
- Deeks J.J., Higgins J.P.T., Altman D.G., editors. Chapter 10: Analysing data and undertaking meta-analyses. Cochrane Handbook for Systematic Reviews of Interventions. The Cochrane Collaboration; In: 2019. [Google Scholar]
- Engel S.M., Miodovnik A., Canfield R.L., Zhu C., Silva M.J., Calafat A.M. Prenatal phthalate exposure is associated with childhood behavior and executive functioning. Environ. Health Perspect. 2010;118:565–571. doi: 10.1289/ehp.0901470. 20106747 [DOI] [PMC free article] [PubMed] [Google Scholar]
- Engel S.M., Villanger G.D., Nethery R.C., Thomsen C., Sakhi A.K., Drover S.S.M. Prenatal phthalates, maternal thyroid function, and risk of attention-deficit hyperactivity disorder in the Norwegian mother and child cohort. Environ. Health Perspect. 2018;126 doi: 10.1289/EHP2358. 29790729 [DOI] [PMC free article] [PubMed] [Google Scholar]
- Eskenazi B., Marks A.R., Bradman A., Harley K., Barr D.B., Johnson C. Organophosphate pesticide exposure and neurodevelopment in young Mexican-American children. Environ. Health Perspect. 2007;115:792–798. doi: 10.1289/ehp.9828. 17520070 [DOI] [PMC free article] [PubMed] [Google Scholar]
- Eskenazi B., Huen K., Marks A., Harley K.G., Bradman A., Barr D.B. PON1 and neurodevelopment in children from the CHAMACOS study exposed to organophosphate pesticides in utero. Environ. Health Perspect. 2010;118:1775–1781. doi: 10.1289/ehp.1002234. 21126941 [DOI] [PMC free article] [PubMed] [Google Scholar]
- Evans S.F., Kobrosly R.W., Barrett E.S., Thurston S.W., Calafat A.M., Weiss B. Prenatal bisphenol a exposure and maternally reported behavior in boys and girls. Neurotoxicology. 2014;45:91–99. doi: 10.1016/j.neuro.2014.10.003. 25307304 [DOI] [PMC free article] [PubMed] [Google Scholar]
- Farzanehfar V., Naderi N., Kobarfard F., Faizi M. Determination of dibutyl phthalate neurobehavioral toxicity in mice. Food Chem. Toxicol. 2016;94:221–226. doi: 10.1016/j.fct.2016.05.006. 27311797 [DOI] [PubMed] [Google Scholar]
- Fei C., Olsen J. Prenatal exposure to perfluorinated chemicals and behavioral or coordination problems at age 7 years. Environ. Health Perspect. 2011;119:573–578. doi: 10.1289/ehp.1002026. 21062688 [DOI] [PMC free article] [PubMed] [Google Scholar]
- Forns J., Iszatt N., White R.A., Mandal S., Sabaredzovic A., Lamoree M. Perfluoroalkyl substances measured in breast milk and child neuropsychological development in a Norwegian birth cohort study. Environ. Int. 2015;83:176–182. doi: 10.1016/j.envint.2015.06.013. 26159671 [DOI] [PubMed] [Google Scholar]
- Forns J., Mandal S., Iszatt N., Polder A., Thomsen C., Lyche J.L. Novel application of statistical methods for analysis of multiple toxicants identifies DDT as a risk factor for early child behavioral problems. Environ. Res. 2016;151:91–100. doi: 10.1016/j.envres.2016.07.014. 27466755 [DOI] [PubMed] [Google Scholar]
- Gaetke L.M., Chow-Johnson H.S., Chow C.K. Copper: toxicological relevance and mechanisms. Arch. Toxicol. 2014;88:1929–1938. doi: 10.1007/s00204-014-1355-y. 25199685 [DOI] [PMC free article] [PubMed] [Google Scholar]
- Gascon M., Valvi D., Forns J., Casas M., Martínez D., Júlvez J. Prenatal exposure to phthalates and neuropsychological development during childhood. Int. J. Hyg. Environ. Health. 2015;218:550–558. doi: 10.1016/j.ijheh.2015.05.006. 26095249 [DOI] [PubMed] [Google Scholar]
- Goodman R. The strengths and difficulties questionnaire: a research note. J. Child Psychol. Psychiatry. 1997;38:581–586. doi: 10.1111/j.1469-7610.1997.tb01545.x. 9255702 [DOI] [PubMed] [Google Scholar]
- Goodman A., Lamping D.L., Ploubidis G.B. When to use broader internalising and externalising subscales instead of the hypothesised five subscales on the strengths and difficulties questionnaire (SDQ): data from British parents, teachers and children. J. Abnorm. Child Psychol. 2010;38:1179–1191. doi: 10.1007/s10802-010-9434-x. 20623175 [DOI] [PubMed] [Google Scholar]
- Grandjean P., Landrigan P.J. Developmental neurotoxicity of industrial chemicals. Lancet. 2006;368(12) doi: 10.1016/S0140-6736(06)69665-7. (PMID: 17174709) [DOI] [PubMed] [Google Scholar]
- Grandjean P., Landrigan P.J. Neurobehavioural effects of developmental toxicity. Lancet Neurol. 2014;13:330–338. doi: 10.1016/S1474-4422(13)70278-3. 24556010 [DOI] [PMC free article] [PubMed] [Google Scholar]
- Grohs M.N., Reynolds J.E., Liu J., Martin J.W., Pollock T., Lebel C. Prenatal maternal and childhood bisphenol a exposure and brain structure and behavior of young children. Environ. Health. 2019;18 doi: 10.1186/s12940-019-0528-9. 31615514 [DOI] [PMC free article] [PubMed] [Google Scholar]
- Gustavsson A., Svensson M., Jacobi F., Allgulander C., Alonso J., Beghi E. Cost of disorders of the brain in Europe 2010. Eur. Neuropsychopharmacol. 2011;21:718–779. doi: 10.1016/j.euroneuro.2011.08.008. 21924589 [DOI] [PubMed] [Google Scholar]
- Harley K.G., Gunier R.B., Kogut K., Johnson C., Bradman A., Calafat A.M. Prenatal and early childhood bisphenol a concentrations and behavior in school-aged children. Environ. Res. 2013;126:43–50. doi: 10.1016/j.envres.2013.06.004. 23870093 [DOI] [PMC free article] [PubMed] [Google Scholar]
- Harrell Jr FE. 2020. rms: regression modeling strategies.
- Hastie T. 2020. gam: generalized additive models.
- Haug L.S., Sakhi A.K., Cequier E., Casas M., Maitre L., Basagana X. In-utero and childhood chemical exposome in six European mother-child cohorts. Environ. Int. 2018;121:751–763. doi: 10.1016/j.envint.2018.09.056. 30326459 [DOI] [PubMed] [Google Scholar]
- Held U., Kessels A., Garcia Aymerich J., Basagaña X., Ter Riet G., Moons K.G.M. Methods for handling missing variables in risk prediction models. Am. J. Epidemiol. 2016;184:545–551. doi: 10.1093/aje/kwv346. 27630143 [DOI] [PubMed] [Google Scholar]
- Higgins J.P.T., Thompson S.G. Quantifying heterogeneity in a meta-analysis. Stat. Med. 2002;21:1539–1558. doi: 10.1002/sim.1186. 12111919 [DOI] [PubMed] [Google Scholar]
- Hoshi H., Ohtsuka T. Adult rats exposed to low-doses of di-n-butyl phthalate during gestation exhibit decreased grooming behavior. Bull. Environ. Contam. Toxicol. 2009;83:62–66. doi: 10.1007/s00128-009-9729-1. 19399352 [DOI] [PubMed] [Google Scholar]
- Høyer B.B., Ramlau-Hansen C.H., Obel C., Pedersen H.S., Hernik A., Ogniev V. Pregnancy serum concentrations of perfluorinated alkyl substances and offspring behaviour and motor development at age 5-9 years-a prospective study. Environ. Health. 2015;14:2. doi: 10.1186/1476-069X-14-2. 25567242 [DOI] [PMC free article] [PubMed] [Google Scholar]
- Ishido M., Masuo Y., Terasaki M., Morita M. Rat hyperactivity by bisphenol a, but not by its derivatives, 3-hydroxybisphenol a or bisphenol a 3,4-quinone. Toxicol. Lett. 2011;206:300–305. doi: 10.1016/j.toxlet.2011.08.011. 21884766 [DOI] [PubMed] [Google Scholar]
- Jolani S., Debray T.P.A., Koffijberg H., van Buuren S., Moons K.G.M. Imputation of systematically missing predictors in an individual participant data meta-analysis: a generalized approach using MICE. Stat. Med. 2015;34:1841–1863. doi: 10.1002/sim.6451. 25663182 [DOI] [PubMed] [Google Scholar]
- Kim Y., Ha E., Kim E., Park H., Ha M., Kim J. Prenatal exposure to phthalates and infant development at 6 months: prospective mothers and children’s environmental health (MOCEH) study. Environ. Health Perspect. 2011;119:1495–1500. doi: 10.1289/ehp.1003178. 21737372 [DOI] [PMC free article] [PubMed] [Google Scholar]
- Kim S., Eom S., Kim H.-J., Lee J.J., Choi G., Choi S. Association between maternal exposure to major phthalates, heavy metals, and persistent organic pollutants, and the neurodevelopmental performances of their children at 1 to 2years of age- CHECK cohort study. Sci. Total Environ. 2018;624:377–384. doi: 10.1016/j.scitotenv.2017.12.058. 29258038 [DOI] [PubMed] [Google Scholar]
- Kobrosly R.W., Evans S., Miodovnik A., Barrett E.S., Thurston S.W., Calafat A.M. Prenatal phthalate exposures and neurobehavioral development scores in boys and girls at 6-10 years of age. Environ. Health Perspect. 2014;122:521–528. doi: 10.1289/ehp.1307063. 24577876 [DOI] [PMC free article] [PubMed] [Google Scholar]
- Komada M., Itoh S., Kawachi K., Kagawa N., Ikeda Y., Nagao T. Newborn mice exposed prenatally to bisphenol a show hyperactivity and defective neocortical development. Toxicology. 2014;323:51–60. doi: 10.1016/j.tox.2014.06.009. 24953688 [DOI] [PubMed] [Google Scholar]
- Krstajic D., Buturovic L.J., Leahy D.E., Thomas S. Cross-validation pitfalls when selecting and assessing regression and classification models. Aust. J. Chem. 2014;6:10. doi: 10.1186/1758-2946-6-10. 24678909 [DOI] [PMC free article] [PubMed] [Google Scholar]
- Lee D.-H., Porta M., Jacobs D.R., Vandenberg L.N. Chlorinated persistent organic pollutants, obesity, and type 2 diabetes. Endocr. Rev. 2014;35:557–601. doi: 10.1210/er.9013-1084. 24483949 [DOI] [PMC free article] [PubMed] [Google Scholar]
- Lee Y.-M., Kim K.-S., Jacobs D.R., Lee D.-H. Persistent organic pollutants in adipose tissue should be considered in obesity research. Obes. Rev. 2017;18:129–139. doi: 10.1111/obr.12481. 27911986 [DOI] [PubMed] [Google Scholar]
- Li M.-X., Yeung J.M.Y., Cherny S.S., Sham P.C. Evaluating the effective numbers of independent tests and significant p-value thresholds in commercial genotyping arrays and public imputation reference datasets. Hum. Genet. 2012;131:747–756. doi: 10.1007/s00439-011-1118-2. 22143225 [DOI] [PMC free article] [PubMed] [Google Scholar]
- Li F., Yang F., Li D.-K., Tian Y., Miao M., Zhang Y. Prenatal bisphenol a exposure, fetal thyroid hormones and neurobehavioral development in children at 2 and 4 years: a prospective cohort study. Sci. Total Environ. 2020;722:137887. doi: 10.1016/j.scitotenv.2020.137887. 32197165 [DOI] [PubMed] [Google Scholar]
- Lien Y.-J., Ku H.-Y., Su P.-H., Chen S.-J., Chen H.-Y., Liao P.-C. Prenatal exposure to phthalate esters and behavioral syndromes in children at 8 years of age: Taiwan maternal and infant cohort study. Environ. Health Perspect. 2015;123:95–100. doi: 10.1289/ehp.1307154. 25280125 [DOI] [PMC free article] [PubMed] [Google Scholar]
- Maitre L., de Bont J., Casas M., Robinson O., Aasvang G.M., Agier L. Human early life Exposome (HELIX) study: a European population-based exposome cohort. BMJ Open. 2018;8 doi: 10.1136/bmjopen-2017-021311. 30206078 [DOI] [PMC free article] [PubMed] [Google Scholar]
- Maitre L, Julvez J, López-Vicente M, Warembourg C, Tamayo-Uria I, Philippat C, et al. submitted to journal. Early-life environmental exposure determinants of child behavior in Europe: a longitudinal, population-based study. n.d.. [DOI] [PMC free article] [PubMed]
- Marks A.R., Harley K., Bradman A., Kogut K., Barr D.B., Johnson C. Organophosphate pesticide exposure and attention in young Mexican-American children: the CHAMACOS study. Environ. Health Perspect. 2010;118:1768–1774. doi: 10.1289/ehp.1002056. 21126939 [DOI] [PMC free article] [PubMed] [Google Scholar]
- Minatoya M., Itoh S., Yamazaki K., Araki A., Miyashita C., Tamura N. Prenatal exposure to bisphenol a and phthalates and behavioral problems in children at preschool age: the Hokkaido study on environment and Children’s health. Environ. Health Prev. Med. 2018;23:43. doi: 10.1186/s12199-018-0732-1. 30193567 [DOI] [PMC free article] [PubMed] [Google Scholar]
- Mustieles V., Fernández M.F. Bisphenol A shapes children’s brain and behavior: towards an integrated neurotoxicity assessment including human data. Environ. Health. 2020:19. doi: 10.1186/s12940-020-00620-y. 32517692 [DOI] [PMC free article] [PubMed] [Google Scholar]
- Mustieles V., Pérez-Lobato R., Olea N., Fernández M.F. Bisphenol a: human exposure and neurobehavior. Neurotoxicology. 2015;49:174–184. doi: 10.1016/j.neuro.2015.06.002. 26121921 [DOI] [PubMed] [Google Scholar]
- Nadarajah S, Kotz S. 2006. R programs for truncated distributions. J stat Softw 16:1–8; doi: 10.18637/jss.v016.c02. [DOI]
- Nakagami A., Negishi T., Kawasaki K., Imai N., Nishida Y., Ihara T. Alterations in male infant behaviors towards its mother by prenatal exposure to bisphenol a in cynomolgus monkeys (Macaca fascicularis) during early suckling period. Psychoneuroendocrinology. 2009;34:1189–1197. doi: 10.1016/j.psyneuen.2009.03.005. 19345509 [DOI] [PubMed] [Google Scholar]
- National Academies of Sciences, Engineering, and Medicine . National Academies Press; Washington, D.C: 2017. Application of Systematic Review Methods in an Overall Strategy for Evaluating Low-Dose Toxicity from Endocrine Active Chemicals. [PubMed] [Google Scholar]
- Nesan D., Sewell L.C., Kurrasch D.M. Opening the black box of endocrine disruption of brain development: lessons from the characterization of Bisphenol a. Horm. Behav. 2018;101:50–58. doi: 10.1016/j.yhbeh.2017.12.001. 29241697 [DOI] [PubMed] [Google Scholar]
- Palanza P., Gioiosa L., vom Saal FS, Parmigiani S. Effects of developmental exposure to bisphenol a on brain and behavior in mice. Environ. Res. 2008;108:150–157. doi: 10.1016/j.envres.2008.07.023. 18949834 [DOI] [PubMed] [Google Scholar]
- Patel C.J., Bhattacharya J., Butte A.J. An environment-wide association study (EWAS) on type 2 diabetes mellitus. PLoS One. 2010;5 doi: 10.1371/journal.pone.0010746. 20505766 [DOI] [PMC free article] [PubMed] [Google Scholar]
- Perera F., Vishnevetsky J., Herbstman J.B., Calafat A.M., Xiong W., Rauh V. Prenatal bisphenol a exposure and child behavior in an inner-city cohort. Environ. Health Perspect. 2012;120:1190–1194. doi: 10.1289/ehp.1104492. 22543054 [DOI] [PMC free article] [PubMed] [Google Scholar]
- Perera F., Nolte E.L.R., Wang Y., Margolis A.E., Calafat A.M., Wang S. Bisphenol a exposure and symptoms of anxiety and depression among inner city children at 10-12 years of age. Environ. Res. 2016;151:195–202. doi: 10.1016/j.envres.2016.07.028. 27497082 [DOI] [PMC free article] [PubMed] [Google Scholar]
- Perrier F., Giorgis-Allemand L., Slama R., Philippat C. Within-subject pooling of biological samples to reduce exposure misclassification in biomarker-based studies. Epidemiology. 2016;27:378–388. doi: 10.1097/EDE.0000000000000460. 27035688 [DOI] [PMC free article] [PubMed] [Google Scholar]
- Philippat C., Nakiwala D., Calafat A.M., Botton J., De Agostini M., Heude B. Prenatal exposure to nonpersistent endocrine disruptors and behavior in boys at 3 and 5 years. Environ. Health Perspect. 2017;125 doi: 10.1289/EHP1314. 28937960 [DOI] [PMC free article] [PubMed] [Google Scholar]
- Pugh S., Hutcheon J., Richardson G., Brooks M., Himes K., Day N. Gestational weight gain, pre-pregnancy body mass index, and offspring attention deficit hyperactivity disorder symptoms and behavior at age 10. BJOG. 2016;123:2094–2103. doi: 10.1111/1471-0528.13909. 26996156 [DOI] [PMC free article] [PubMed] [Google Scholar]
- R Core Team, R Foundation for Statistical Computing. 2020. R: a language and environment for statistical computing.
- Richmond R.C., Al-Amin A., Davey Smith G., Relton C.L. Approaches for drawing causal inferences from epidemiological birth cohorts: a review. Early Hum. Dev. 2014;90:769–780. doi: 10.1016/j.earlhumdev.2014.08.023. 25260961 [DOI] [PMC free article] [PubMed] [Google Scholar]
- Rochester J.R., Bolden A.L., Kwiatkowski C.F. Prenatal exposure to bisphenol a and hyperactivity in children: a systematic review and meta-analysis. Environ. Int. 2018;114:343–356. doi: 10.1016/j.envint.2017.12.028. 29525285 [DOI] [PubMed] [Google Scholar]
- Roen E.L., Wang Y., Calafat A.M., Wang S., Margolis A., Herbstman J. Bisphenol a exposure and behavioral problems among inner city children at 7–9 years of age. Environ. Res. 2015;142:739–745. doi: 10.1016/j.envres.2015.01.014. 25724466 [DOI] [PMC free article] [PubMed] [Google Scholar]
- Rosenquist AH, Høyer BB, Julvez J, Sunyer J, Pedersen HS, Lenters V, et al. 2017. Prenatal and postnatal PCB-153 and p,p’-DDE exposures and behavior scores at 5–9 years of age among children in Greenland and Ukraine. Environ. Health Perspect. 125:107002; doi: 10.1289/EHP553. PMID: 28974479. [DOI] [PMC free article] [PubMed]
- RStudio Team . RStudio; Inc: 2020. RStudio: Integrated Development for R. [Google Scholar]
- Sapbamrer R., Hongsibsong S. Effects of prenatal and postnatal exposure to organophosphate pesticides on child neurodevelopment in different age groups: a systematic review. Environ. Sci. Pollut. Res. Int. 2019;26:18267–18290. doi: 10.1007/s11356-019-05126-w. 31041704 [DOI] [PubMed] [Google Scholar]
- Scheiber I.F., Mercer J.F.B., Dringen R. Metabolism and functions of copper in brain. Prog. Neurobiol. 2014;116:33–57. doi: 10.1016/j.pneurobio.2014.01.002. 24440710 [DOI] [PubMed] [Google Scholar]
- Siroux V., Agier L., Slama R. The exposome concept: a challenge and a potential driver for environmental health research. Eur. Respir. Rev. 2016;25:124–129. doi: 10.1183/16000617.0034-2016. 27246588 [DOI] [PMC free article] [PubMed] [Google Scholar]
- Stacy S.L., Papandonatos G.D., Calafat A.M., Chen A., Yolton K., Lanphear B.P. Early life bisphenol a exposure and neurobehavior at 8 years of age: identifying windows of heightened vulnerability. Environ. Int. 2017;107:258–265. doi: 10.1016/j.envint.2017.07.021. 28764921 [DOI] [PMC free article] [PubMed] [Google Scholar]
- Tamayo-Uria I., Maitre L., Thomsen C., Nieuwenhuijsen M.J., Chatzi L., Siroux V. The early-life exposome: description and patterns in six European countries. Environ. Int. 2019;123:189–200. doi: 10.1016/j.envint.2018.11.067. 30530161 [DOI] [PMC free article] [PubMed] [Google Scholar]
- Tanner E.M., Hallerbäck M.U., Wikström S., Lindh C., Kiviranta H., Gennings C. Early prenatal exposure to suspected endocrine disruptor mixtures is associated with lower IQ at age seven. Environ. Int. 2020;134:105185. doi: 10.1016/j.envint.2019.105185. 31668669 [DOI] [PubMed] [Google Scholar]
- Tessari L., Angriman M., Díaz-Román A., Zhang J., Conca A., Cortese S. Association between exposure to pesticides and ADHD or autism spectrum disorder: a systematic review of the literature. J. Atten. Disord. 2020;108705472094040 doi: 10.1177/1087054720940402. 32697136 [DOI] [PubMed] [Google Scholar]
- Tian Y.-H., Baek J.-H., Lee S.-Y., Jang C.-G. Prenatal and postnatal exposure to bisphenol a induces anxiolytic behaviors and cognitive deficits in mice. Synapse. 2010;64:432–439. doi: 10.1002/syn.20746. 20169576 [DOI] [PubMed] [Google Scholar]
- Tibshirani R. Regression shrinkage and selection via the lasso. J R Stat Soc B. 1996;58:267–288. [Google Scholar]
- van Buuren S, Groothuis-Oudshoorn K. 2011. Mice: multivariate imputation by chained equations in R. J stat Softw 45; doi: 10.18637/jss.v045.i03. [DOI]
- van den Dries M.A., Guxens M., Pronk A., Spaan S., El Marroun H., Jusko T.A. Organophosphate pesticide metabolite concentrations in urine during pregnancy and offspring attention-deficit hyperactivity disorder and autistic traits. Environ. Int. 2019;131:105002. doi: 10.1016/j.envint.2019.105002. 31369979 [DOI] [PMC free article] [PubMed] [Google Scholar]
- Venables W.N., Ripley B.D. 4. ed. Springer; New York: 2002. Modern Applied Statistics with S. [Google Scholar]
- Verner M.-A., McDougall R., Glynn A., Andersen M.E., Clewell H.J., Longnecker M.P. Is the relationship between prenatal exposure to PCB-153 and decreased birth weight attributable to pharmacokinetics? Environ. Health Perspect. 2013;121:1219–1224. doi: 10.1289/ehp.1206457. 23934733 [DOI] [PMC free article] [PubMed] [Google Scholar]
- Vrijheid M., Slama R., Robinson O., Chatzi L., Coen M., van den Hazel P. The human early-life Exposome (HELIX): project rationale and design. Environ. Health Perspect. 2014;122:535–544. doi: 10.1289/ehp.1307204. 24610234 [DOI] [PMC free article] [PubMed] [Google Scholar]
- Vukelic J., Kapamadzija A., Petrovic D., Grujic Z., Novakov-Mikic A., Kopitovic V. Variations of serum copper values in pregnancy. Srp. Arh. Celok. Lek. 2012;140:42–46. doi: 10.2298/SARH1202042V. 22462346 [DOI] [PubMed] [Google Scholar]
- Wang Z., Ma S., Wang C.-Y. Variable selection for zero-inflated and overdispersed data with application to health care demand in Germany. Biom. J. 2015;57:867–884. doi: 10.1002/bimj.201400143. 26059498 [DOI] [PMC free article] [PubMed] [Google Scholar]
- White I.R., Royston P., Wood A.M. Multiple imputation using chained equations: issues and guidance for practice. Stat. Med. 2011;30:377–399. doi: 10.1002/sim.4067. 21225900 [DOI] [PubMed] [Google Scholar]
- Whyatt R.M., Liu X., Rauh V.A., Calafat A.M., Just A.C., Hoepner L. Maternal prenatal urinary phthalate metabolite concentrations and child mental, psychomotor, and behavioral development at 3 years of age. Environ. Health Perspect. 2012;120:290–295. doi: 10.1289/ehp.1103705. 21893441 [DOI] [PMC free article] [PubMed] [Google Scholar]
- Wood A.M., White I.R., Royston P. How should variable selection be performed with multiply imputed data? Stat. Med. 2008;27:3227–3246. doi: 10.1002/sim.3177. 18203127 [DOI] [PubMed] [Google Scholar]
- Yan B., Guo J., Liu X., Li J., Yang X., Ma P. Oxidative stress mediates dibutyl phthalate induced anxiety-like behavior in Kunming mice. Environ. Toxicol. Pharmacol. 2016;45:45–51. doi: 10.1016/j.etap.2016.05.013. 27262985 [DOI] [PubMed] [Google Scholar]
Associated Data
This section collects any data citations, data availability statements, or supplementary materials included in this article.
Supplementary Materials
Supplementary material