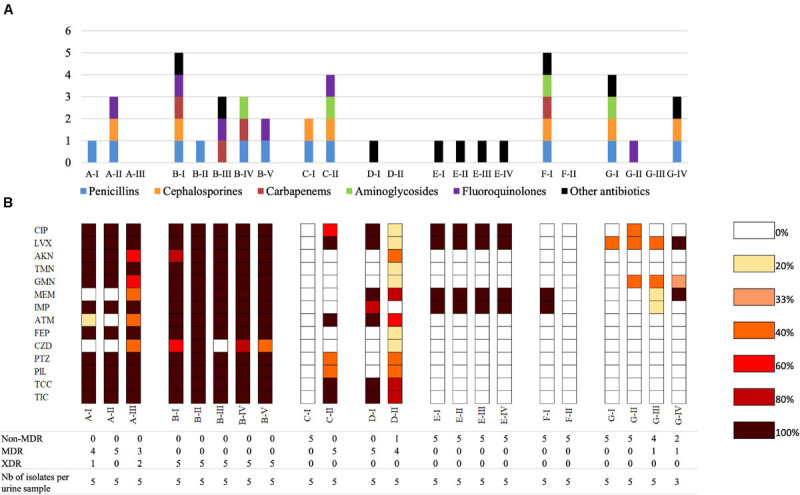
FIGURE 2.

Antimicrobial resistance of P. aeruginosa urinary isolates. (A) Previous antibiotic therapy received by patients; in the previous 6 months before the first urine culture or in the laps of time between two urine cultures. (B) Heatmap representing antibiotic resistance of P. aeruginosa urinary isolates per urine culture. For each urine culture, the percentages of isolates resistant to each antibiotic were calculated. For example, when 2 of 5 isolates collected from a given urine sample were resistant to ticarcillin, the resistance rate was 20%. TIC, ticarcillin; TCC, ticarcillin-clavulanate; PIL, piperacillin; PTZ, piperacillin-tazobactam; CZD, ceftazidime; FEP, cefepime; ATM, aztreonam; IMP, imipenem; MEM, meropenem; GMN, gentamicin; TMN, tobramycin; AKN, amikacin; CIP, ciprofloxacin; LVX, levofloxacin. The numbers below the heatmap represent the number of isolates with non-MDR, MDR or XDR resistance profiles within a given urine sample.
