
FIGURE 4.
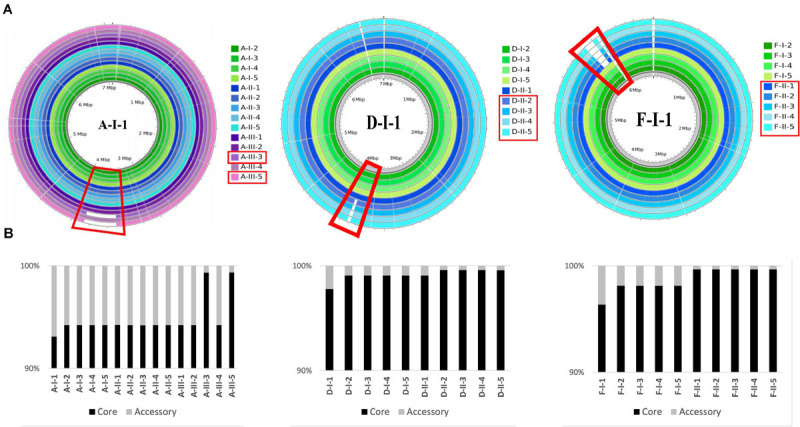
Genomic deletions identified in late isolates collected from three patients (A, D, F). (A) Genome coverage for isolates collected from three patients (A, D, F). Genome coverage is represented according to Illumina read mapping by Snippy on their corresponding PacBio reference sequence. Green, blue, and purple colors indicate that the isolates are from sample I, II, and III, respectively. Samples and genomic regions where large deletions occurred in late isolates are framed by red rectangles. (B) Proportion of the core and accessory genomes for isolates collected from three patients (A, D, F). The proportions were calculated based on the core alignments produced by Snippy. The size of the core genome was 6,598,293 bp, 6,854,231 bp, and 6,472,838 bp, for A-, D-, and F-isolates, respectively.