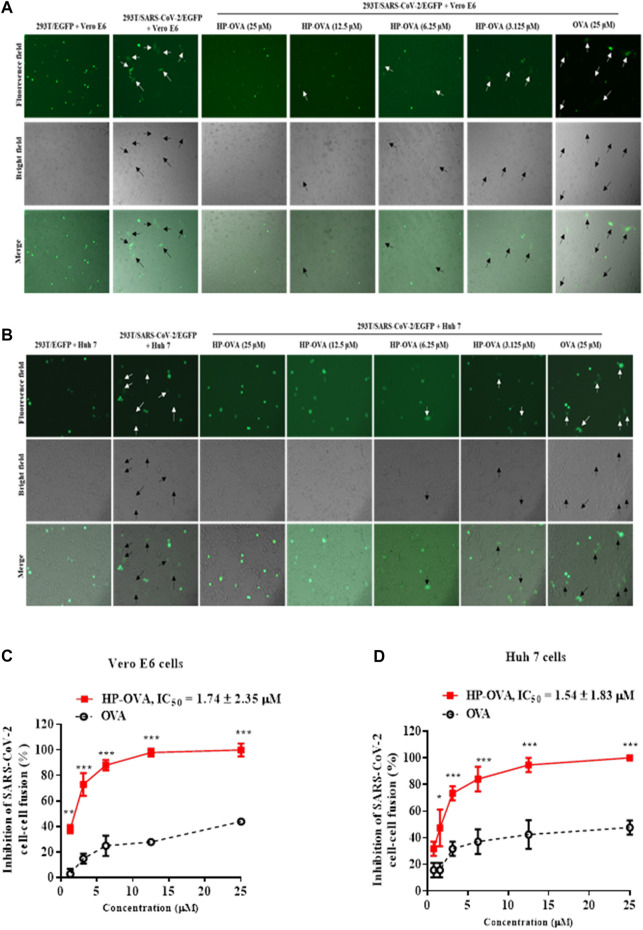
FIGURE 2.
Inhibitory activity of HP-OVA against SARS-CoV-2 S-mediated cell-cell fusion. Images were captured at 12 h after treatment with HP-OVA or OVA on SARS-CoV-2 S protein-mediated cell-cell fusion. The syncytia of Vero E6 cells (A) or Huh 7 cells (B) and HEK293T cells with SARS-CoV-2 overexpression are marked in the pictures. Representative results from three fields were selected randomly from each sample with scale bars of 50 μm (C, D) The number of syncytia was counted under an inverted fluorescence microscope, and the percentage of inhibition was calculated as described in the Methods. Data are presented as the mean ± SD of triplicate samples from a representative experiment (*p < 0.05, **p < 0.01, ***p < 0.001).

