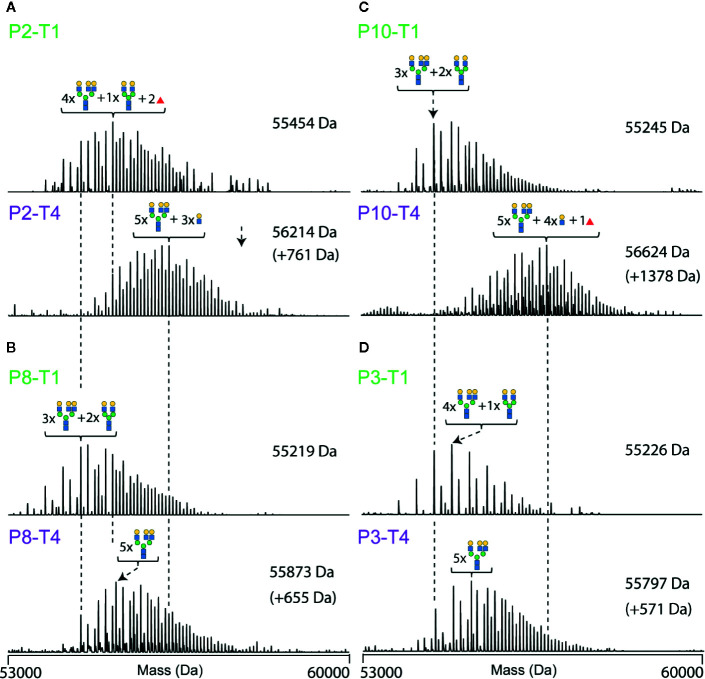
Figure 6.
Deconvoluted native mass spectra of desialylated AACT, illustrating unique differences in between patients and the extensive glycoproteoform remodeling observed between T1 and T4. Spectra are shown for four patients, each at two-time points (T1 at the top and T4 at the bottom). Data for patient P2 are shown in (A), P8 in (B), P10 in (C), and P3 in (D). The most abundant peak in each spectrum is annotated with a likely glycan composition. As a visual guide, dashed lines connect peaks of the same mass.

