Figure 4.
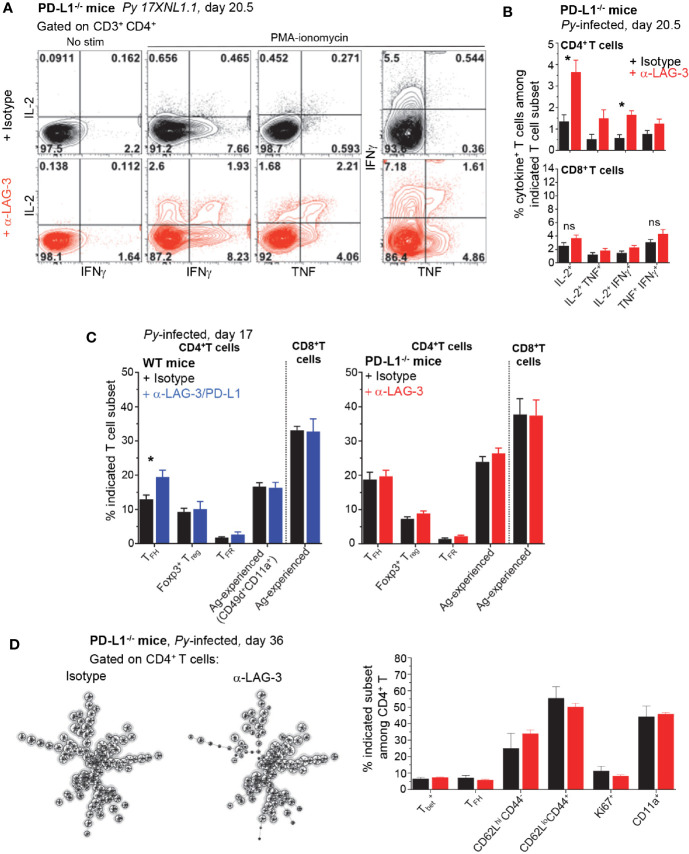
Lymphocyte Activation Gene 3 (LAG-3) blockade in PD-L1-/- mice partially restores CD4+ T cell dysfunction. Spleen cells from day 20.5 Py-infected PD-L1-/- or WT mice, treated with either anti-LAG-3/PD-L1, anti-LAG-3 or isotype Ab i.v. (as indicated, on days 9, 12, 15) were stained for cell-surface CD3, CD4 and CD8, Foxp3, Bcl6, ICOS and intracellular cytokines IL-2, IFNγ, and TNF after incubation with PMA/ionomycin for 4 h (T cell mix). (A) Representative FACS dot plots of two independent experiments are shown with the frequencies of cytokine-producing cells among CD4+ T cells (n=3–5). (B) Graphs of the average frequencies of cytokine-producing cells among CD4+ T cells (shown in (A)) and CD8+ T cells with SEM. P-values are indicated when applicable. (C) Distribution of known splenic T cell subsets as indicated on day 17 post infection, TFH data are from the same experiment shown in Figure 7. Graphs average one to two independent experiments (n=4-5) shown with SEM. (D) Spleen cells from day 36 PD-L1-/- Py-infected mice treated with either anti-LAG-3 or isotype Ab i.v. (on days 9, 12, 15) were stained for lineage markers (CD8, CD4, CD3, Bcl6, Tbet) and functional markers (CD62L, CD44, CD11a) with a 24 color panel depicted in S3A Fig. FlowSOM analysis (left) on pooled CD4+ T cells (n=5) and summary bar graphs from each treatment group are shown (right). Distribution of known splenic T cell subsets as indicated on day 36 post infection. Student t-test was conducted between groups and p-values are indicated when applicable (*p < 0.05).

