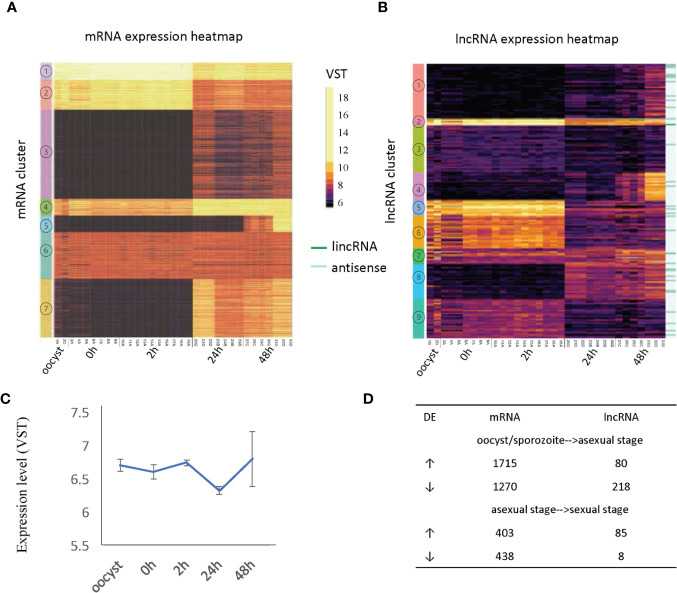
Figure 3.
Developmentally regulated lncRNAs. (A) Heatmap of mRNA expression across 33 RNA-Seq samples (Table 1). (B) Heatmap of lncRNA expression (396 transcripts) across 33 RNA-Seq samples (Table 1). Expression clusters generated by K-means are indicated by colored bars on the left-most edge. The 33 lincRNAs are identified by dark green lines on the righthand side of the figure. (C) The average expression level and standard deviation of lncRNAs at each time point. (D) Differentially expressed (DE) genes are compared between developmental transitions (oocyst/sporozoite stage, 24 h asexual stage and 48 h sexual stages. The arrows indicate the direction of change in gene expression. Normalized gene expression values are colored as indicated in the scale located between panels A and B with yellow indicating the highest levels.

