Figure 4.
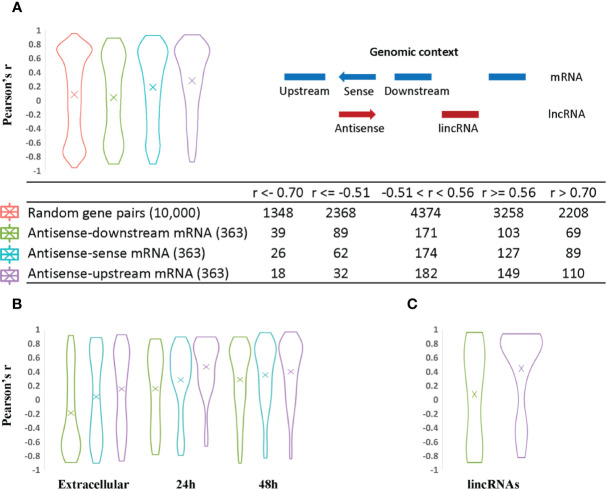
Analysis of lncRNA transcript expression correlation with sense and neighboring mRNA genes. The Pearson correlation coefficient was used to measure the expression correlation of different types of gene pair relationships using VST expression levels from the 33 RNA-Seq samples. The width of the plot is indicative of the number of genes at a given Pearson correlation value. (A) Antisense expression relationships with sense and neighboring mRNAs. Random gene pairs were selected from all genes including lncRNAs to assess their expression correlation as the background control. The relative genomic position of lncRNAs relative to other neighboring genes is indicated on the righthand side. For example, a given antisense RNA (red arrow) is shown relative to its sense gene mRNA on the opposite DNA strand and upstream and downstream mRNA encoding genes (shown in blue). The coding strand of the upstream and downstream mRNAs may be positive or negative for the purpose of the calculations. This context was used to evaluate the statistics for each category of lncRNA/mRNA relationship pair. The results are listed in the table at the bottom of panel (A). (B) Antisense expression correlation with sense mRNA and neighboring gene mRNAs are distributed according to parasite developmental stage. Antisense transcripts were assigned to different developmental stages based on their expression peak. The mean value is indicated by an “X” in each plot. (C) LincRNA expression correlation with neighboring gene mRNAs.

