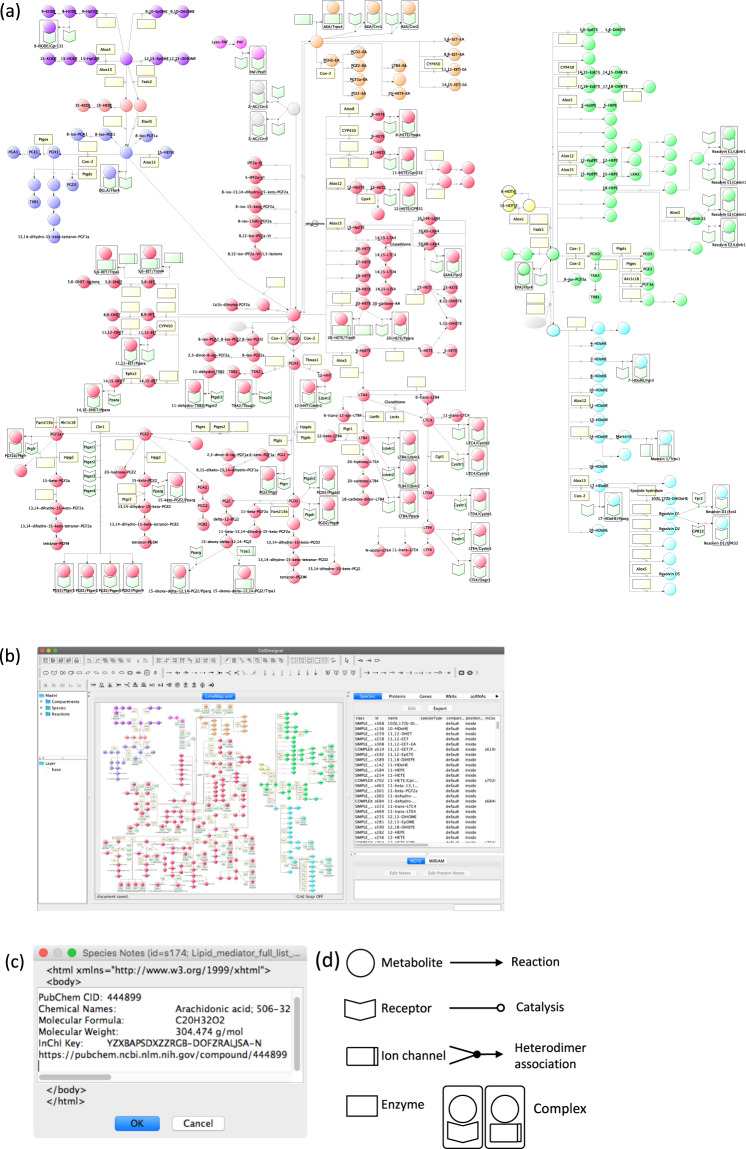
Fig. 1. Lipid mediator metabolic pathway map (LimeMap).
a LimeMap includes a total of 282 factors (222 lipid mediators and metabolites, 60 enzymes and receptors) and 279 reactions. The LimeMap file, SBML compliant format created with CellDesigner version 4.4, is available as Additional Data (LimeMap.xml). The list of lipid metabolite abbreviations is provided in Supplementary Table 1. The magnified pathway maps are shown in Supplementary Fig. 1. b The SBML file is opened in CellDesigner. c Information on each factor is annotated in the notes section. d Definition of the symbols used to build the map. Circle symbols show metabolites, square symbols in light yellow show enzymes, arrowhead symbols show receptors, and separated square symbols show ion channels. Complexes of metabolite and receptor or ion channel are indicated with a grey-colored square. Lines with an arrow show metabolic reactions, lines with an open circle connected to a metabolic reaction show enzymatic reactions, and arrowhead symbols with two connected lines show heterodimer association. Color coding indicates the grouping of metabolites; Red for AA derived lipid mediators, purple for LA derived lipid mediators, salmon pink for GLA and EDA derived lipid mediators, blue for DGLA derived lipid mediators, pink for Lyso-PAF and PAF, orange for AEA derived lipid mediators, yellow for ALA derived lipid mediator, light green for EPA derived lipid mediator, and light blue for DHA derived lipid mediators.

