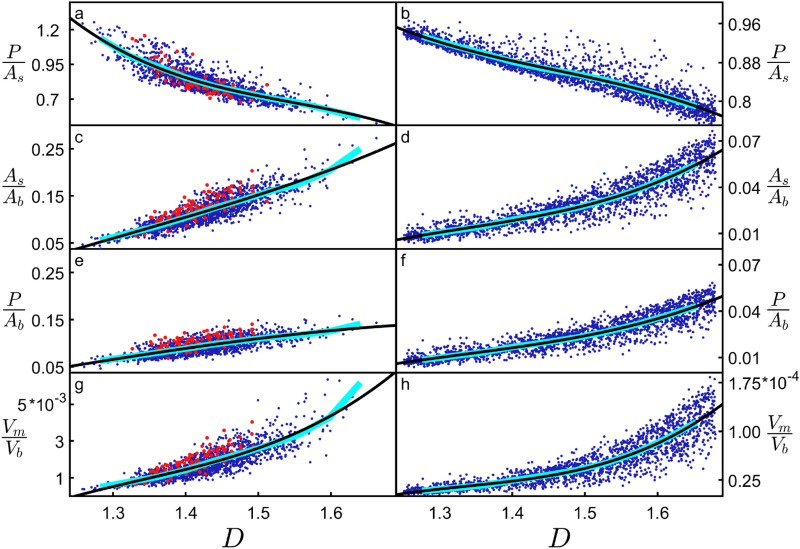
Figure 4.
Dependences of various parameters (see text for parameter definitions) on D for neurons (left column) and H-Trees (right column). Red data are for unmanipulated basal arbors while the blue data are for basal arbors where either their θ or ϕ values are manipulated. H-Trees with straight and with weaving branches are included. The cyan lines correspond with binned averages of the plots while the black curves correspond to 3rd degree polynomial fits to the data.

