Figure 5.
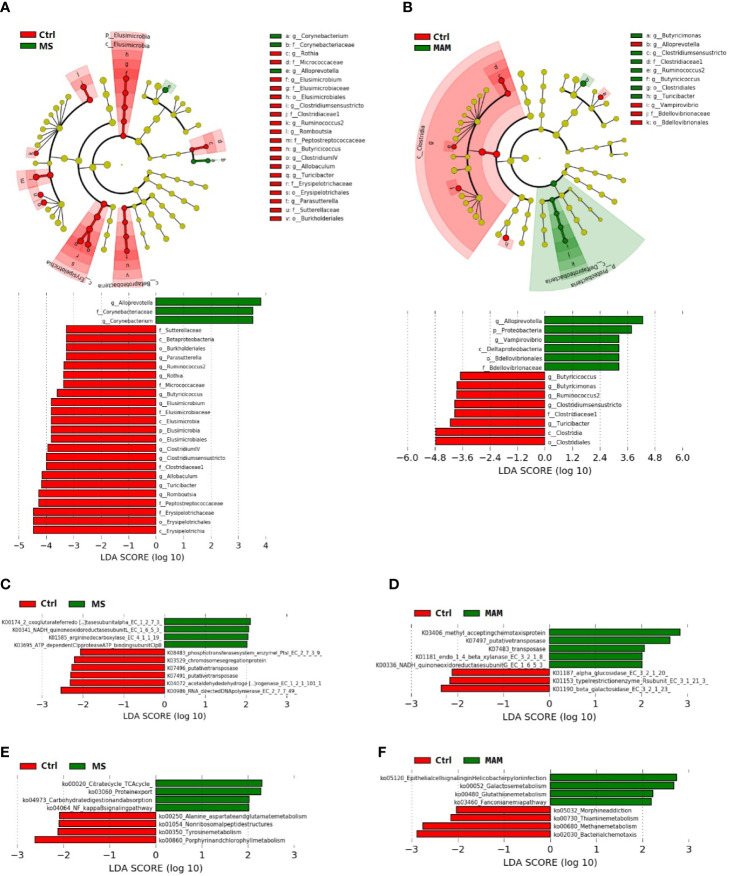
Linear discriminant effect size (LEfSe) analyses comparing differentially abundant taxa and the KEGG-based ortholog functions and pathways between control and MS group communities and control and MAM group communities. (A, B) The differences in gut microbiota taxa between different model groups. The phylogenic relationship of the taxon with differences were shown in the cladogram. (C, D) Differences of KEGG-based ortholog (KO) inferred functions in gut microbiota between different model groups. (E, F) Differences in KO pathways predicted from gut microbiota compositions between different model groups.

