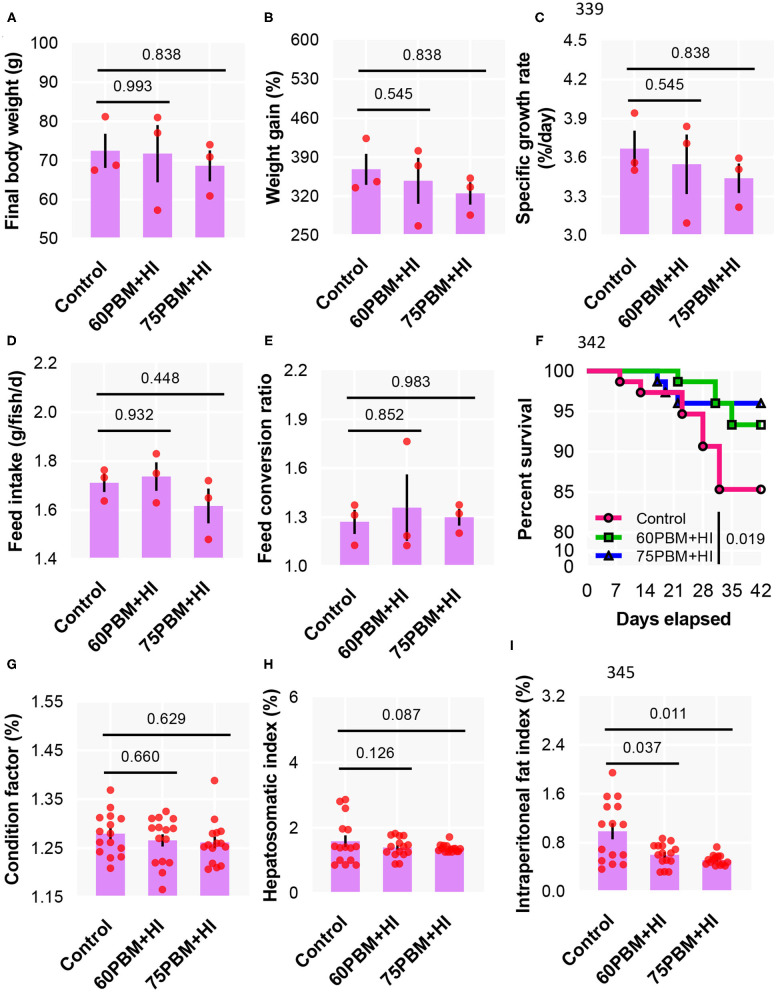
Figure 1.
Growth performance (A–C), feed utilization (D,E), survival (F), and biometry indices (G–I) of barramundi 6 weeks post-feeding with control, 60% FM replacement diet (60PBM + HI), and 75% FM replacement diet (75PBM + HI), supplemented with 10% full-fat HI larvae. The results represent mean ± SEM of three values. P-values on the top of the bar with scatter dot plot denote significant differences between control vs. 60PBM + HI-fed and 75PBM + HI-fed fish (ordinary one-way ANOVA, followed by Dunnet's multiple comparison test, P < 0.05). The asterisk denotes significant differences between control vs. 60PBM + HI-fed and 75PBM + HI-fed fish (Kaplan–Meier survival method, followed by log-rank test, P < 0.05).

