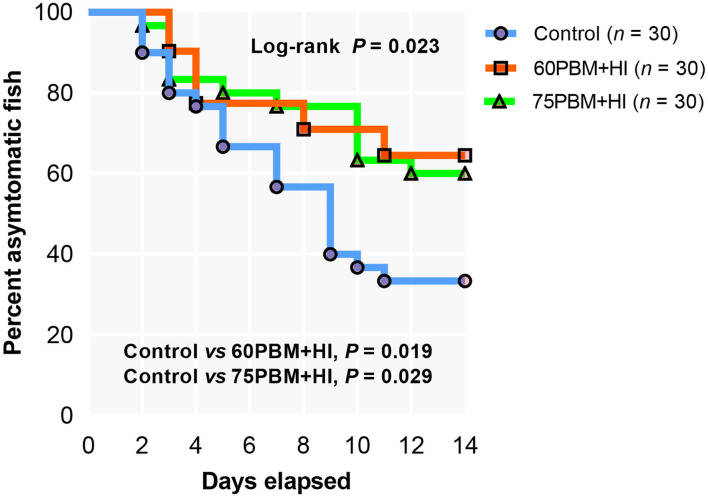
Figure 3.
Kaplan–Meier curve of barramundi fed with control, 60% FM replacement diet (60PBM + HI), and 75% FM replacement diet (75PBM + HI), supplemented with 10% full-fat HI larvae in response to Vibrio harveyi challenge over a period of 2 weeks. The control groups demonstrated infection at 2 days post-challenge, whereas 60PBM + HI and 74PBM + HI groups demonstrated infection 3 days post-challenge. P-values denote significant differences between control vs. 60PBM + HI-fed and 75PBM + HI-fed fish (Kaplan–Meier survival method, followed by log-rank test, P < 0.05).

