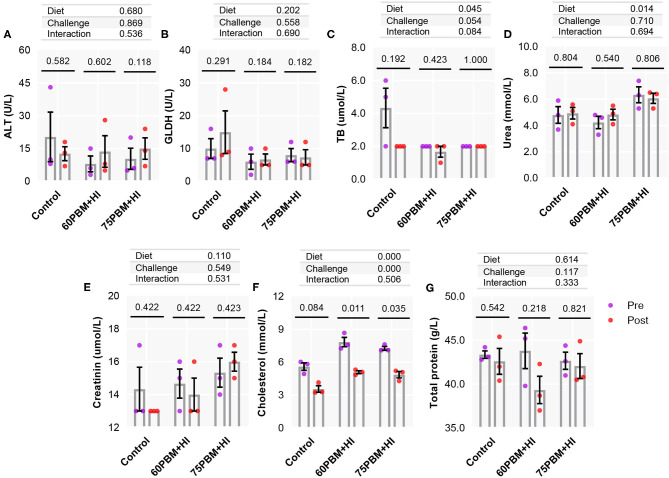
Figure 4.
Serum biochemical changes (A–G) in pre-challenge and 24-h post-challenge juvenile barramundi fed control, 60% FM replacement diet (60PBM + HI), and 75% FM replacement diet (75PBM + HI), supplemented with 10% full-fat HI larvae. The bar represents the mean of three technical replicates. The violet and the red markers (each marker represents the mean of two biological replicates) denote pre-challenge and post-challenge groups, respectively. P-values on the top of the bar with scatter dot plot denote significant differences between pre- and post-challenge groups fed control and HI-supplemented PBM diets (paired t-test, P < 0.05). The effect of diet and challenge and their interaction were analyzed by two-way ANOVA with Dunnett's multiple-comparisons test.

