Figure 5.
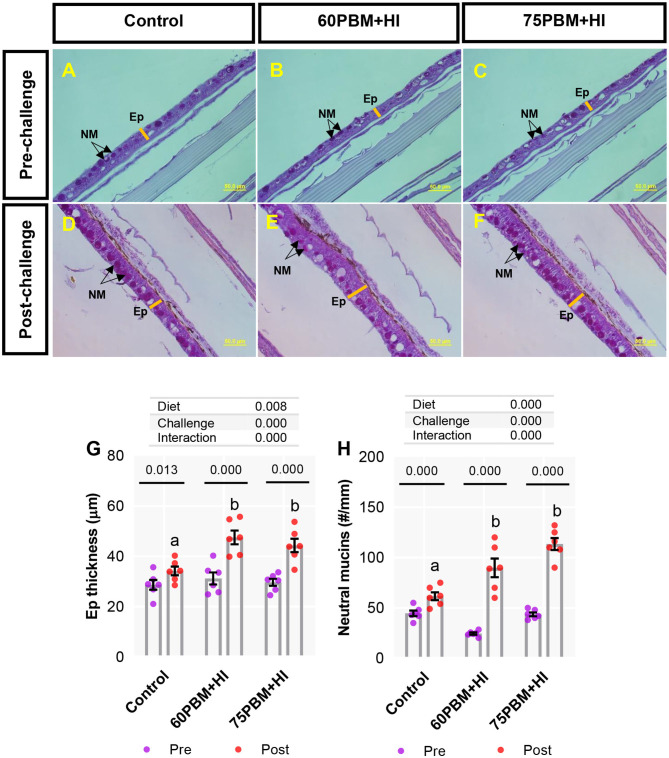
Light microscopy of skin histometry and histochemistry (periodic acid–Schiff, ×40 magnification) in pre-challenge (A–C) and at 24-h post-challenge (D–F) barramundi fed control, 60% FM replacement diet (60PBM + HI), and 75% FM replacement diet (75PBM + HI), supplemented with 10% full-fat HI larvae. Variation in the Ep thickness (G) and the number of goblet cells producing neutral mucins (H) in the skin of pre-challenge and post-challenge barramundi fed different test diets. P-values on the top of the bar with scatter dot plot denote significant differences between pre- and post-challenge groups fed control and HI-supplemented PBM diets (paired t-test, P < 0.05). Different letters on the top of the bar with scatter dot plot denote significant differences between control vs. 60PBM + HI-fed and 75PBM + HI-fed fish (one-way ANOVA, followed by Dunnett's multiple-comparisons test, P < 0.05). The effect of “diet” and “challenge” and their interaction were analyzed by two-way ANOVA with Dunnett's multiple-comparisons test. The bar indicates the mean of six values. The violet and the red markers denote pre-challenge and post-challenge groups, respectively. EP, epidermis; NM, neutral mucins.

