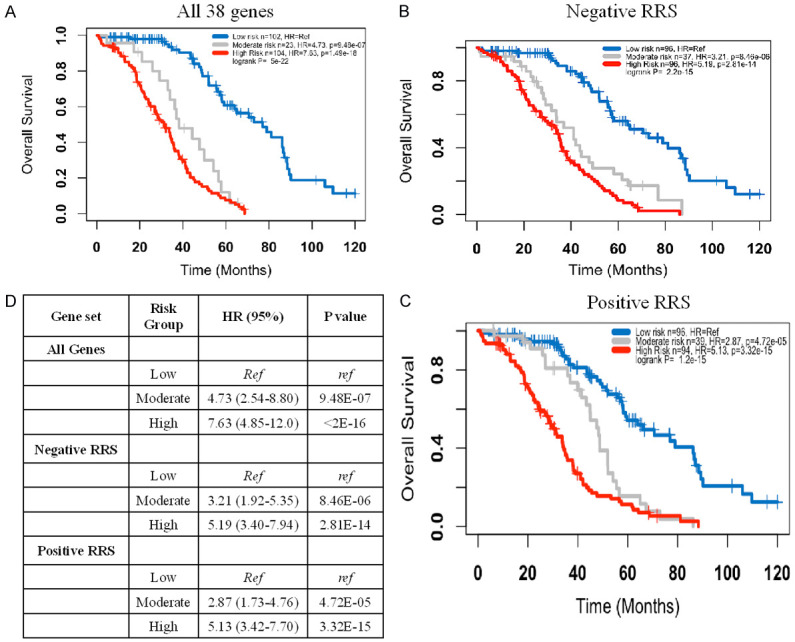
Figure 3.

Kaplan Meier curve for the entire dataset. A. Models using all 38 genes; B. Models using the 20 of the 38 genes that have mainly lower expression in the high risk group and HR < 1 (mostly immune genes); C. Models using the 18 of the 38 genes that have mainly higher expression in the high risk group and HR > 1 (mostly tumor intrinsic genes); D. Summary statistics.
