Figure 3.
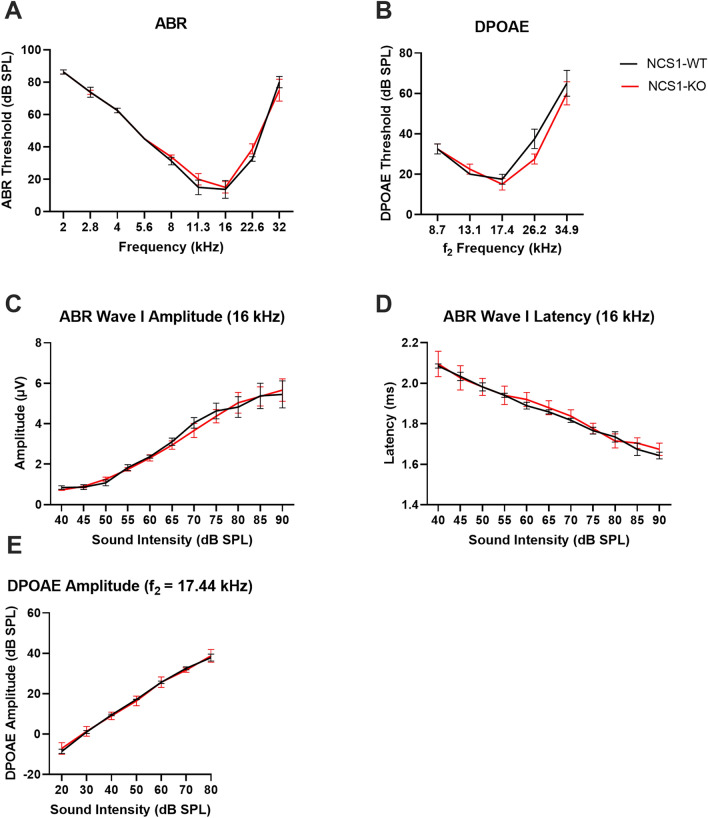
NCS1-WT and -KO mice exhibit similar hearing. (A,B) The graphs illustrated the average ABR (A) and DPOAE (B) thresholds of NCS1-KO and -WT mice as a function of stimulus frequency. There were no significant differences in both ABR (2-way ANOVA, Factor genotype, p = 0.67) and DPOAE (2-way ANOVA, Factor genotype, p = 0.22) thresholds between NCS1-KO and NCS1-WT mice across the frequency range tested. (C,D) The graphs illustrated the average amplitude (C) and latency (D) of ABR wave I as a function of sound intensity at 16 kHz. There were no significant differences in both amplitudes and latencies between NCS1-KO and NCS1-WT mice at all sound intensities. (E) The graph illustrated the average DPOAE amplitude as a function of sound intensity at the f2 frequency of 17.44 kHz. There were no significant differences in DPOAE amplitudes at all sound intensities. Error bars are ± SEM. Male NCS1-WT: n = 2, male NCS1-KO: n = 2, female NCS1-WT: n = 2, female NCS1-KO: n = 2.

