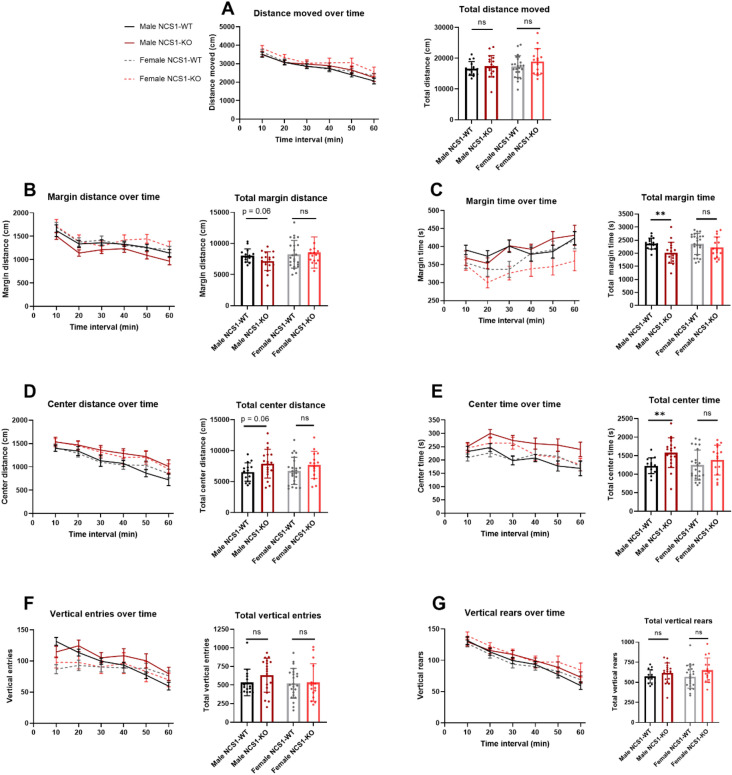
Figure 5.
Male NCS1-KO mice exhibit hyperactivity in the open-field exploration task. Graphs show (A) distance moved (no differences), (B) margin distance (unpaired t-test, p = 0.06 for male NCS1-WT vs. male NCS1-KO, (C) margin time (unpaired t-test, p = 0.005 for male NCS1-WT vs. male NCS1-KO), (D) center distance (unpaired t-test, p = 0.06 for male NCS1-WT vs. male NCS1-KO), (E) center time (unpaired t-test, p = 0.005 for male NCS1-WT vs. male NCS1-KO); (F) vertical entries (no differences), and (G) vertical rears (no differences). Line graphs show mean ± SEM. Bar graphs show mean ± SD. Two-tailed student t-test was used to compare male NCS1-WT with male NCS1-KO, and female NCS1-WT with female NCS1-KO. Male NCS1-WT: n = 15, male NCS1-KO: n = 18, female NCS1-WT: n = 15, female NCS1-KO: n = 23.

