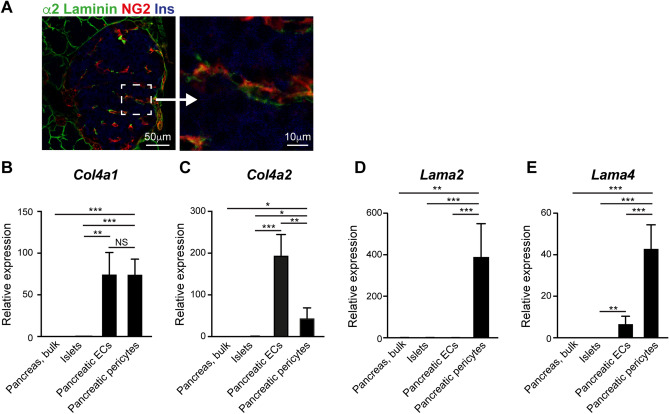
Figure 2.
Pancreatic pericytes and endothelial cells differ in their expression of BM components. (A) Immunofluorescence analysis of mouse pancreatic tissue for α2 laminin (green), the pericytic marker NG2 (red), and insulin (blue). Right panel shows a higher magnification of the area demarked by a dashed line. (B–E) Bar diagrams show expression levels of indicated genes determined by qPCR. RNA was extracted from bulk pancreatic tissues, islets (average was set to '1’), pancreatic endothelial cells (ECs), and pancreatic pericytes (isolated as described in Fig. 1). N = 3–5. *, p < 0.05; **, p < 0.001; ***, p < 0.005.

