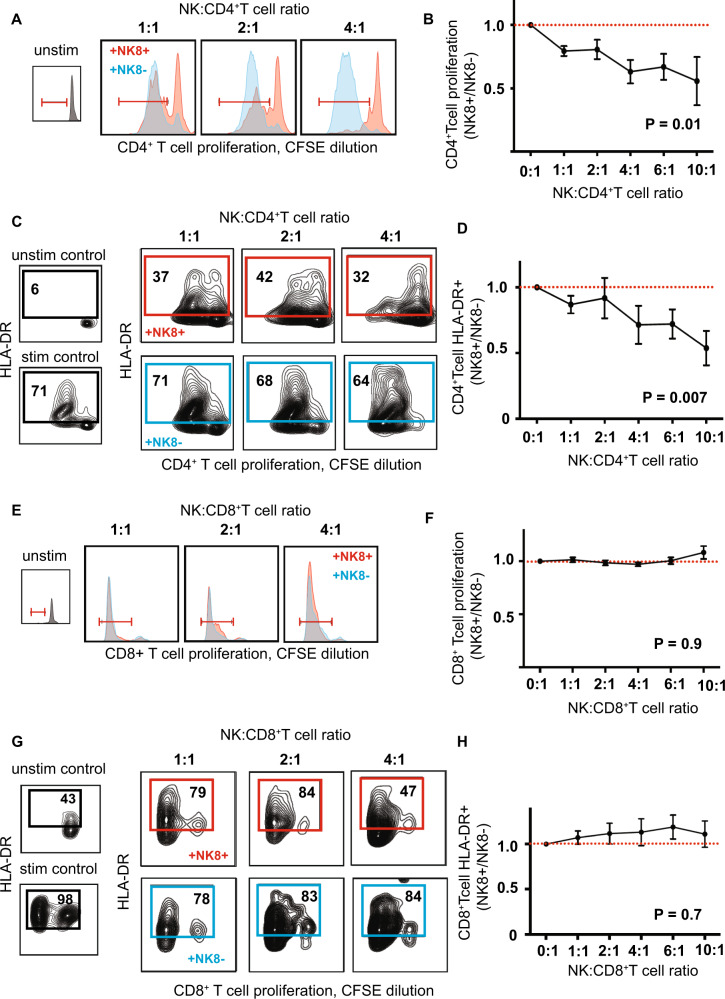
Fig. 2. NK8 cells regulate autologous CD4+ T cell activation.
Representative histograms (A, E), contour plots (C, G) and summary scatter/line plots (B, D, F, H) showing flow cytometric quantification of CD4+ (A–D) and CD8+ (E–H) T cell proliferation (A, B, E, F, CFSE dilution) and activation (HLADR expression, C, D, G, H) when unstimulated (inset, black) or following polyclonal stimulation in vitro (anti-CD2/3/28 bead) in the presence of a titrated ratio of autologous NK8+ (red) or NK8− (blue) cells as indicated. Summary NK8+ results (B, D, F, H) expressed as ratio relative to paired NK8− cell-enriched culture. P = 2-way ANOVA with NK:T ratio as the categorical variable. For b, d, f and h n = 5 independent biological replicates per group. Error bars = mean + /− sem, red dashed line = no difference vs control.

